EUR/USD
> Analyses

 Thank you
Reply
Chart
Thank you
Reply
Chart
SBernukhov_Exness has published a new analysis.
- 12
- 65
- 40
- 0
Timeframe : 1H - Simple chart
Euro remains to be in focus along with other assets, as US markets lose attractiveness among investors, especially from China, who start to put more focus on European and Japanese bonds rather than…
EUR/GBP
> Analyses
 Thank you
Reply
Chart
Thank you
Reply
Chart
SBernukhov_Exness has published a new analysis.
- 12
- 65
- 40
- 0
Timeframe : Daily - Simple chart
Euro has gained a remarkable strength against the British pound during the latest round of tariff announcement from the US administration. However, from the historical studies we know that EURGBP…
WTI CRUDE OIL
> Analyses
 Thank you
Reply
Chart
Thank you
Reply
Chart
SBernukhov_Exness has published a new analysis.
- 12
- 65
- 40
- 0
Timeframe : Daily - Simple chart
Crude oil had initiated a classical short coverage rally: despite a big bullish day, around 2% (42699 contracts on Nymex) of total open interest for Crude oil futures was liquidated, which means that…
EUR/USD
> Analyses
 Thank you
Reply
Chart
Thank you
Reply
Chart
SBernukhov_Exness has published a new analysis.
- 12
- 65
- 40
- 0
Timeframe : Daily - Simple chart
EURUSD had bounced off to the 200-day moving average, having trimmed its recent gains amid a local growth of yields of 30-year bonds of the US. The pressure looks quite strong, but the 200-day moving…
WTI CRUDE OIL
> Analyses
 Thank you
Reply
Chart
Thank you
Reply
Chart
SBernukhov_Exness has published a new analysis.
- 12
- 65
- 40
- 0
Timeframe : 30 min. - Simple chart
Crude oil had reached the psychological level of $70, and that might become a potential crash test for the rally: should the level be rejected, it may trigger a liquidation of the upside move, as this…
WTI CRUDE OIL
> Analyses
 Thank you
Reply
Chart
Thank you
Reply
Chart
SBernukhov_Exness has published a new analysis.
- 12
- 65
- 40
- 0
Timeframe : Daily - Simple chart
Crude oil is under pressure as political narratives drive it lower. The $70 area is a fair price according to the supply/demand estimate from the Energy Administration of the United States.
The…
GOLD - USD
> Analyses
 Thank you
Reply
Chart
Thank you
Reply
Chart
SBernukhov_Exness has published a new analysis.
- 12
- 65
- 40
- 0
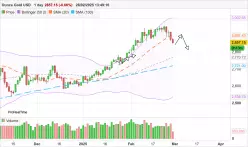
Timeframe : Daily - Simple chart
Gold had plummeted for the 3rd day in a row, sliding from the peak of the range, as the upswing for Gold was already mature and developing for more than 46 days without any meaningful correction. So,…
BAIDU INC. ADS
> Analyses
 Thank you
Reply
Chart
Thank you
Reply
Chart
SBernukhov_Exness has published a new analysis.
- 12
- 65
- 40
- 0
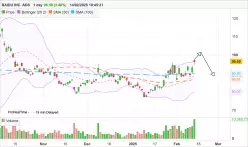
Timeframe : Daily - Simple chart
Despite the strong driving narrative, BIDU had displayed less prominent growth than BABA, and had reached the upper border of Bollinger bands indicator with a parameter of 50. This usually might…
ALIBABA GROUP HOLDING
> Analyses
 Thank you
Reply
Chart
Thank you
Reply
Chart
SBernukhov_Exness has published a new analysis.
- 12
- 65
- 40
- 0
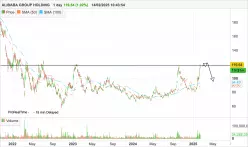
Timeframe : Daily - Simple chart
Alibaba stock price was moving in a sharp rally within the last two weeks period, having reached the psychological level of $117 and a strong resistance area. If this level holds, it’s possible to…
ETHEREUM - ETH/USD
> Analyses
 Thank you
Reply
Chart
Thank you
Reply
Chart
SBernukhov_Exness has published a new analysis.
- 12
- 65
- 40
- 0
Timeframe : 30 min. - Simple chart
ETHUSD Short Setup – Bearish Breakout Potential📉 Technical Setup:Ethereum is forming a narrowing structure, and a downside breakout of the trendline could trigger an acceleration towards $2400…

