
- Status :
- Language : English
- Registered on :
- Analyses : 4
- Overall rating : 7
- Comments : 1
- Followers : 0
- Followed : 0
Profile of the trader allformarkets
allformarkets has not yet completed the description
NASDAQ100 INDEX
> Analyses
 Thank you
Reply
Chart
Thank you
Reply
Chart
allformarkets has published a new analysis.
- 0
- 4
- 7
- 1
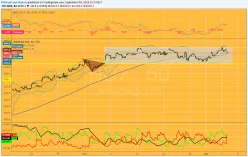
Timeframe : 1H - Simple chart
The Nasdaq100 lives in a rectangle that has been build in the long-term chart (1w) above 4779.4. It seems at the moment want to go to the bottom of the drawer. Loss level would generate a lot of…
USD/JPY
> Analyses - Comments
 Thank you
Reply
Chart
Thank you
Reply
Chart
allformarkets posted a new comment.
- 0
- 4
- 7
- 1
Yeap Bruno!!
- 0
- 4
- 7
- 1
Timeframe : 4H - Simple chart
The cross is in the top of the channel. MACD over 0. Just when to arrive the 0 line, with an uptick in volatility, will be time to open long positions again, but with the trend line so close, maybe…
USD/JPY
> Analyses
Thank you
Reply
Chart
allformarkets has published a new analysis.
- 0
- 4
- 7
- 1
Timeframe : 4H - Simple chart
The cross is in the top of the channel. MACD over 0. Just when to arrive the 0 line, with an uptick in volatility, will be time to open long positions again, but with the trend line so close, maybe…
USD/CHF
> Analyses
 Thank you
Reply
Chart
Thank you
Reply
Chart
allformarkets has published a new analysis.
- 0
- 4
- 7
- 1
Timeframe : 4H - Chart + Trading signal
4H Forecast:
The price moves within a channel right now on your bottom line. The MACD seems to rest above zero, with the possibility of upward continuity with the target in 0.986. With stop…
USD/CHF
> Analyses
 Thank you
Reply
Chart
Thank you
Reply
Chart
allformarkets has published a new analysis.
- 0
- 4
- 7
- 1
Timeframe : 4H - Chart + Trading signal
Possibly you are drawing an inverted SHS, so this bearish movement aiming main objective 0.96, the price of the previous shoulder. Also around that area, a reversal of the previous movement appears.

