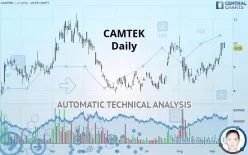
CAMTEK - Daily - Technical analysis published on 09/16/2019 (GMT)
- 318
- 0
- Who voted?
Click here for a new analysis!
- Timeframe : Daily
- - Analysis generated on
- Status : TARGET REACHED

Summary of the analysis

Additional analysis
Quotes
CAMTEK rating 9.78 USD. The price is lower by -2.10% since the last closing and was between 9.78 USD and 10.02 USD. This implies that the price is at 0% from its lowest and at -2.40% from its highest.A bullish opening was detected by the Central Gaps scanner. Buyers are trying to impose a bullish momentum in the very short term.
Bullish opening
Type : Bullish
Timeframe : Openning
Here is a more detailed summary of the historical variations registered by CAMTEK:
Technical
Technical analysis of CAMTEK in Daily shows a strongly overall bullish trend. 82.14% of the signals given by moving averages are bullish. This strongly bullish trend is supported by the strong bullish signals given by short-term moving averages. The Central Indicators market scanner is currently detecting a bullish signal that could impact this trend:
Moving Average bullish crossovers : MA50 & MA100
Type : Bullish
Timeframe : Daily
The probability of a further increase is high given the direction of the technical indicators.
Caution: the Central Indicators scanner currently detects an excess:
CCI indicator is overbought : over 100
Type : Neutral
Timeframe : Daily
Previous candle closed over Bollinger bands
Type : Neutral
Timeframe : Daily
Williams %R indicator is overbought : over -20
Type : Neutral
Timeframe : Daily
Pivot points : price is over resistance 2
Type : Neutral
Timeframe : Weekly
Pivot points : price is under support 1
Type : Neutral
Timeframe : Daily
The analysis of the price chart with Central Patterns scanners does not return any result.
The Central Candlesticks scanner which studies Japanese candlesticks did not detect anything.
| S3 | S2 | S1 | Price | R1 | R2 | R3 | |
|---|---|---|---|---|---|---|---|
| ProTrendLines | 7.73 | 8.71 | 9.23 | 9.78 | 9.99 | 10.44 | 10.81 |
| Change (%) | -20.96% | -10.94% | -5.62% | - | +2.15% | +6.75% | +10.53% |
| Change | -2.05 | -1.07 | -0.55 | - | +0.21 | +0.66 | +1.03 |
| Level | Major | Intermediate | Major | - | Major | Minor | Major |
Pivot points can also be used to set your price objectives. Here is the price situation in relation to pivot points:
| Pivot points | S3 | S2 | S1 | PP | R1 | R2 | R3 |
|---|---|---|---|---|---|---|---|
| Standard | 9.53 | 9.62 | 9.81 | 9.90 | 10.09 | 10.18 | 10.37 |
| Camarilla | 9.91 | 9.94 | 9.96 | 9.99 | 10.02 | 10.04 | 10.07 |
| Woodie | 9.57 | 9.65 | 9.85 | 9.93 | 10.13 | 10.21 | 10.41 |
| Fibonacci | 9.62 | 9.73 | 9.80 | 9.90 | 10.01 | 10.08 | 10.18 |
| Pivot points | S3 | S2 | S1 | PP | R1 | R2 | R3 |
|---|---|---|---|---|---|---|---|
| Standard | 8.26 | 8.52 | 8.88 | 9.14 | 9.50 | 9.76 | 10.12 |
| Camarilla | 9.08 | 9.14 | 9.19 | 9.25 | 9.31 | 9.36 | 9.42 |
| Woodie | 8.32 | 8.55 | 8.94 | 9.17 | 9.56 | 9.79 | 10.18 |
| Fibonacci | 8.52 | 8.75 | 8.90 | 9.14 | 9.37 | 9.52 | 9.76 |
| Pivot points | S3 | S2 | S1 | PP | R1 | R2 | R3 |
|---|---|---|---|---|---|---|---|
| Standard | 6.09 | 7.10 | 8.07 | 9.09 | 10.06 | 11.07 | 12.04 |
| Camarilla | 8.49 | 8.68 | 8.86 | 9.04 | 9.22 | 9.40 | 9.59 |
| Woodie | 6.06 | 7.09 | 8.05 | 9.08 | 10.03 | 11.06 | 12.02 |
| Fibonacci | 7.10 | 7.86 | 8.33 | 9.09 | 9.85 | 10.31 | 11.07 |
Numerical data
The following is the status of technical indicators and moving averages registered at the time this technical analysis was created:
| RSI (14): | 62.59 | |
| MACD (12,26,9): | 0.2200 | |
| Directional Movement: | 13.52 | |
| AROON (14): | 85.71 | |
| DEMA (21): | 9.51 | |
| Parabolic SAR (0,02-0,02-0,2): | 8.76 | |
| Elder Ray (13): | 0.50 | |
| Super Trend (3,10): | 8.95 | |
| Zig ZAG (10): | 9.78 | |
| VORTEX (21): | 1.1600 | |
| Stochastique (14,3,5): | 93.72 | |
| TEMA (21): | 9.68 | |
| Williams %R (14): | -16.11 | |
| Chande Momentum Oscillator (20): | 1.12 | |
| Repulse (5,40,3): | 1.7800 | |
| ROCnROLL: | 1 | |
| TRIX (15,9): | 0.1600 | |
| Courbe Coppock: | 17.22 |
| MA7: | 9.56 | |
| MA20: | 9.12 | |
| MA50: | 9.00 | |
| MA100: | 8.94 | |
| MAexp7: | 9.60 | |
| MAexp20: | 9.27 | |
| MAexp50: | 9.06 | |
| MAexp100: | 8.94 | |
| Price / MA7: | +2.30% | |
| Price / MA20: | +7.24% | |
| Price / MA50: | +8.67% | |
| Price / MA100: | +9.40% | |
| Price / MAexp7: | +1.88% | |
| Price / MAexp20: | +5.50% | |
| Price / MAexp50: | +7.95% | |
| Price / MAexp100: | +9.40% |
News
Don"t forget to follow the news on CAMTEK. At the time of publication of this analysis, the latest news was as follows:
- Camtek Announces Results for the Second Quarter of 2019
- Camtek Schedules Second Quarter 2019 Results Release and Conference Call for Tuesday, August 6, 2019
- Camtek Closed the Transaction With Chroma
- Camtek Obtains Shareholders' and CFIUS' Approvals for the Chroma Transaction
- Camtek Announces Record Results for the First Quarter of 2019
About author

Online


Add a comment
Comments
0 comments on the analysis CAMTEK - Daily