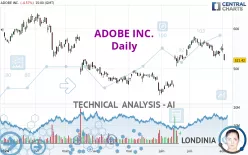
ADOBE INC. - Daily - Technical analysis published on 08/02/2024 (GMT)
- 190
- 0
- Timeframe : Daily
- - Analysis generated on
- Status : NEUTRAL

Summary of the analysis

Additional analysis
Quotes
The ADOBE INC. rating is 521.42 USD. The price is lower by -4.57% since the last closing and was traded between 521.42 USD and 536.84 USD over the period. The price is currently at 0% from its lowest and -2.87% from its highest.The Central Gaps scanner detects a bearish gap which is a sign that the sellers have taken the lead in the very short term.
Opening Gap DOWN
Type : Bearish
Timeframe : Openning
So that you have an overall view of the price change, here is a table showing the variations over several periods:
New LOW record (1 month)
Type : Bearish
Timeframe : Weekly
Technical
Technical analysis of this Daily chart of ADOBE INC. indicates that the overall trend is not clearly defined. The slightly bearish signals currently given by short-term moving averages could allow the overall trend to return to a slightly bearish trend. The Central Indicators market scanner is currently detecting a bearish signal that could impact this trend:
Bearish price crossover with adaptative moving average 50
Type : Bearish
Timeframe : Daily
On the 18 technical indicators analysed, 4 are bullish, 6 are neutral and 8 are bearish. Caution: the Central Indicators scanner currently detects an excess:
CCI indicator is oversold : under -100
Type : Neutral
Timeframe : Daily
Williams %R indicator is oversold : under -80
Type : Neutral
Timeframe : Daily
Pivot points : price is under support 1
Type : Neutral
Timeframe : Weekly
Pivot points : price is under support 3
Type : Neutral
Timeframe : Daily
RSI indicator is back under 50
Type : Bearish
Timeframe : Daily
Parabolic SAR indicator bearish reversal
Type : Bearish
Timeframe : Daily
An analysis of the price chart with the Central Patterns scanner (detector of chart patterns and resistances and supports) shows several results that can have an impact on the price change:
Near horizontal resistance
Type : Bearish
Timeframe : Daily
Near support of channel
Type : Bullish
Timeframe : Daily
The presence of a bearish pattern in Japanese candlesticks detected by Central Candlesticks that could cause a correction in the very short term was also detected:
Downside gap
Type : Bearish
Timeframe : Daily
| S3 | S2 | S1 | Price | R1 | R2 | R3 | |
|---|---|---|---|---|---|---|---|
| ProTrendLines | 439.02 | 463.56 | 492.97 | 521.42 | 533.80 | 578.61 | 604.49 |
| Change (%) | -15.80% | -11.10% | -5.46% | - | +2.37% | +10.97% | +15.93% |
| Change | -82.40 | -57.86 | -28.45 | - | +12.38 | +57.19 | +83.07 |
| Level | Intermediate | Minor | Intermediate | - | Major | Major | Minor |
Pivot points can also be used to set your price objectives. Here is the price situation in relation to pivot points:
| Pivot points | S3 | S2 | S1 | PP | R1 | R2 | R3 |
|---|---|---|---|---|---|---|---|
| Standard | 515.37 | 527.80 | 537.11 | 549.54 | 558.85 | 571.28 | 580.59 |
| Camarilla | 540.43 | 542.42 | 544.42 | 546.41 | 548.40 | 550.40 | 552.39 |
| Woodie | 513.80 | 527.02 | 535.54 | 548.76 | 557.28 | 570.50 | 579.02 |
| Fibonacci | 527.80 | 536.11 | 541.24 | 549.54 | 557.85 | 562.98 | 571.28 |
| Pivot points | S3 | S2 | S1 | PP | R1 | R2 | R3 |
|---|---|---|---|---|---|---|---|
| Standard | 494.02 | 510.81 | 526.62 | 543.41 | 559.22 | 576.01 | 591.82 |
| Camarilla | 533.48 | 536.46 | 539.45 | 542.44 | 545.43 | 548.42 | 551.41 |
| Woodie | 493.54 | 510.57 | 526.14 | 543.17 | 558.74 | 575.77 | 591.34 |
| Fibonacci | 510.81 | 523.26 | 530.95 | 543.41 | 555.86 | 563.55 | 576.01 |
| Pivot points | S3 | S2 | S1 | PP | R1 | R2 | R3 |
|---|---|---|---|---|---|---|---|
| Standard | 473.02 | 500.30 | 525.98 | 553.26 | 578.94 | 606.22 | 631.90 |
| Camarilla | 537.09 | 541.94 | 546.80 | 551.65 | 556.51 | 561.36 | 566.21 |
| Woodie | 472.21 | 499.90 | 525.17 | 552.86 | 578.13 | 605.82 | 631.09 |
| Fibonacci | 500.30 | 520.53 | 533.03 | 553.26 | 573.49 | 585.99 | 606.22 |
Numerical data
The following are the details of the technical indicators and moving averages that were collected to generate this technical analysis:
| RSI (14): | 42.61 | |
| MACD (12,26,9): | 1.7600 | |
| Directional Movement: | -4.15 | |
| AROON (14): | -92.86 | |
| DEMA (21): | 549.01 | |
| Parabolic SAR (0,02-0,02-0,2): | 561.98 | |
| Elder Ray (13): | -12.94 | |
| Super Trend (3,10): | 571.33 | |
| Zig ZAG (10): | 526.90 | |
| VORTEX (21): | 0.7900 | |
| Stochastique (14,3,5): | 34.32 | |
| TEMA (21): | 539.06 | |
| Williams %R (14): | -98.83 | |
| Chande Momentum Oscillator (20): | -38.70 | |
| Repulse (5,40,3): | -4.4200 | |
| ROCnROLL: | 2 | |
| TRIX (15,9): | 0.1800 | |
| Courbe Coppock: | 8.93 |
| MA7: | 538.71 | |
| MA20: | 551.52 | |
| MA50: | 520.18 | |
| MA100: | 506.17 | |
| MAexp7: | 539.07 | |
| MAexp20: | 543.34 | |
| MAexp50: | 530.60 | |
| MAexp100: | 525.56 | |
| Price / MA7: | -3.21% | |
| Price / MA20: | -5.46% | |
| Price / MA50: | +0.24% | |
| Price / MA100: | +3.01% | |
| Price / MAexp7: | -3.27% | |
| Price / MAexp20: | -4.03% | |
| Price / MAexp50: | -1.73% | |
| Price / MAexp100: | -0.79% |
News
The latest news and videos published on ADOBE INC. at the time of the analysis were as follows:
- Readymag Nominated for the Webby Awards Alongside Adobe and Vimeo as the Best Digital Tool for Creative Production
- Adobe Announces Generative AI Solutions to Jumpstart Content Supply Chain for Enterprises
- Oshyn Introduces Reliability Report at Adobe Summit
-
 Look ahead: US producer prices; retail sales; Adobe; Dollar General
- Thinking about trading options or stock in Tesla, Coinbase Global, Adobe, Crowdstrike, or Meta Platforms?
About author

Online


Add a comment
Comments
0 comments on the analysis ADOBE INC. - Daily