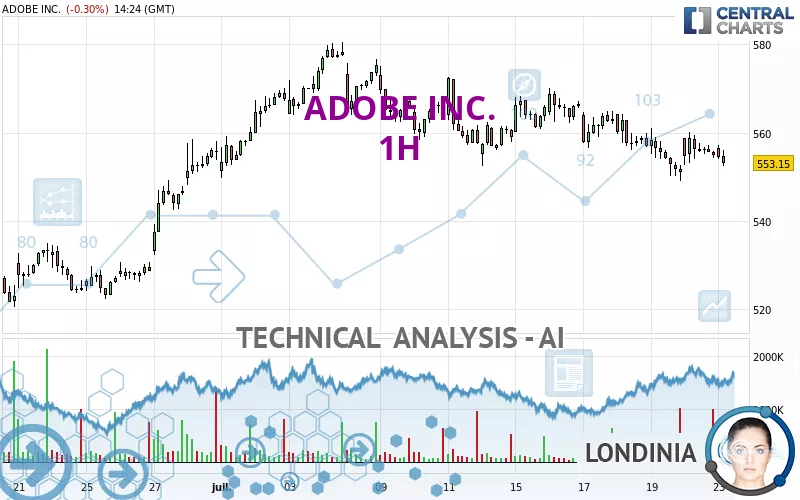
ADOBE INC. - 1H - Technical analysis published on 07/23/2024 (GMT)
- 181
- 0
Click here for a new analysis!
- Timeframe : 1H
- - Analysis generated on
- Status : TARGET REACHED
Summary of the analysis

Additional analysis
Quotes
The ADOBE INC. price is 554.41 USD. On the day, this instrument lost -0.07% and was traded between 553.81 USD and 557.25 USD over the period. The price is currently at +0.11% from its lowest and -0.51% from its highest.The Central Gaps scanner detects a bullish opening. A small advantage for buyers in the very short term.
Bullish opening
Type : Bullish
Timeframe : Openning
So that you have an overall view of the price change, here is a table showing the variations over several periods:
Near a new HIGH record (1 month)
Type : Bullish
Timeframe : Weekly
Technical
Technical analysis of ADOBE INC. in 1H shows a overall strongly bearish trend. 85.71% of the signals given by moving averages are bearish. This strongly bearish trend is supported by the strong bearish signals given by short-term moving averages. The Central Indicators scanner does not detect any result on moving averages that would impact this trend.
The technical indicators are generally neutral. They do not provide relevant information on the direction of future price movements.
Other results related to technical indicators were also found by the Central Indicators scanner:
Price is back under the pivot point
Type : Bearish
Timeframe : Weekly
Momentum indicator is back over 0
Type : Bullish
Timeframe : 1 hour
Williams %R indicator is back over -50
Type : Bullish
Timeframe : 1 hour
The Central Patterns scanner, which studies chart patterns, resistances and supports, has identified this signal:
Near horizontal support
Type : Bullish
Timeframe : 1 hour
The Central Candlesticks scanner which studies Japanese candlesticks did not detect anything.
| S3 | S2 | S1 | Price | R1 | R2 | R3 | |
|---|---|---|---|---|---|---|---|
| ProTrendLines | 505.38 | 533.80 | 552.32 | 554.41 | 578.61 | 604.49 | 634.76 |
| Change (%) | -8.84% | -3.72% | -0.38% | - | +4.37% | +9.03% | +14.49% |
| Change | -49.03 | -20.61 | -2.09 | - | +24.20 | +50.08 | +80.35 |
| Level | Minor | Major | Minor | - | Major | Minor | Major |
Attention could also be paid to pivot points to set price objectives:
| Pivot points | S3 | S2 | S1 | PP | R1 | R2 | R3 |
|---|---|---|---|---|---|---|---|
| Standard | 544.14 | 548.43 | 551.62 | 555.91 | 559.10 | 563.39 | 566.58 |
| Camarilla | 552.76 | 553.45 | 554.13 | 554.82 | 555.51 | 556.19 | 556.88 |
| Woodie | 543.60 | 548.16 | 551.08 | 555.64 | 558.56 | 563.12 | 566.04 |
| Fibonacci | 548.43 | 551.28 | 553.05 | 555.91 | 558.76 | 560.53 | 563.39 |
| Pivot points | S3 | S2 | S1 | PP | R1 | R2 | R3 |
|---|---|---|---|---|---|---|---|
| Standard | 522.13 | 535.55 | 543.27 | 556.69 | 564.41 | 577.83 | 585.55 |
| Camarilla | 545.19 | 547.12 | 549.06 | 551.00 | 552.94 | 554.88 | 556.81 |
| Woodie | 519.29 | 534.13 | 540.43 | 555.27 | 561.57 | 576.41 | 582.71 |
| Fibonacci | 535.55 | 543.62 | 548.61 | 556.69 | 564.76 | 569.75 | 577.83 |
| Pivot points | S3 | S2 | S1 | PP | R1 | R2 | R3 |
|---|---|---|---|---|---|---|---|
| Standard | 353.35 | 394.97 | 475.25 | 516.87 | 597.15 | 638.77 | 719.05 |
| Camarilla | 522.02 | 533.19 | 544.37 | 555.54 | 566.71 | 577.89 | 589.06 |
| Woodie | 372.69 | 404.64 | 494.59 | 526.54 | 616.49 | 648.44 | 738.39 |
| Fibonacci | 394.97 | 441.53 | 470.30 | 516.87 | 563.43 | 592.20 | 638.77 |
Numerical data
The following is the status of the technical indicators and moving averages at the time of publication of this technical analysis:
| RSI (14): | 44.35 | |
| MACD (12,26,9): | -1.4800 | |
| Directional Movement: | -0.73 | |
| AROON (14): | 14.29 | |
| DEMA (21): | 554.11 | |
| Parabolic SAR (0,02-0,02-0,2): | 551.75 | |
| Elder Ray (13): | -0.54 | |
| Super Trend (3,10): | 562.28 | |
| Zig ZAG (10): | 554.46 | |
| VORTEX (21): | 0.9300 | |
| Stochastique (14,3,5): | 48.47 | |
| TEMA (21): | 553.93 | |
| Williams %R (14): | -53.16 | |
| Chande Momentum Oscillator (20): | 0.05 | |
| Repulse (5,40,3): | -0.7400 | |
| ROCnROLL: | 2 | |
| TRIX (15,9): | -0.0500 | |
| Courbe Coppock: | 0.60 |
| MA7: | 558.89 | |
| MA20: | 558.45 | |
| MA50: | 511.45 | |
| MA100: | 507.77 | |
| MAexp7: | 554.97 | |
| MAexp20: | 556.23 | |
| MAexp50: | 558.54 | |
| MAexp100: | 554.82 | |
| Price / MA7: | -0.80% | |
| Price / MA20: | -0.72% | |
| Price / MA50: | +8.40% | |
| Price / MA100: | +9.19% | |
| Price / MAexp7: | -0.10% | |
| Price / MAexp20: | -0.33% | |
| Price / MAexp50: | -0.74% | |
| Price / MAexp100: | -0.07% |
News
The last news published on ADOBE INC. at the time of the generation of this analysis was as follows:
- Readymag Nominated for the Webby Awards Alongside Adobe and Vimeo as the Best Digital Tool for Creative Production
- Adobe Announces Generative AI Solutions to Jumpstart Content Supply Chain for Enterprises
- Oshyn Introduces Reliability Report at Adobe Summit
-
 Look ahead: US producer prices; retail sales; Adobe; Dollar General
- Thinking about trading options or stock in Tesla, Coinbase Global, Adobe, Crowdstrike, or Meta Platforms?
About author
Online


Add a comment
Comments
0 comments on the analysis ADOBE INC. - 1H