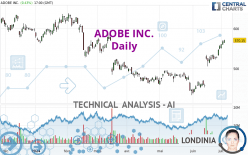
ADOBE INC. - Daily - Technical analysis published on 07/05/2024 (GMT)
- 90
- 0
Click here for a new analysis!
- Timeframe : Daily
- - Analysis generated on
- Status : INVALID

Summary of the analysis

Additional analysis
Quotes
ADOBE INC. rating 570.15 USD. The price has increased by +0.43% since the last closing with the lowest point at 564.00 USD and the highest point at 571.83 USD. The deviation from the price is +1.09% for the low point and -0.29% for the high point.The Central Gaps scanner detects a bearish opening. A small advantage for sellers in the very short term.
Bearish opening
Type : Bearish
Timeframe : Openning
A study of price movements over other periods shows the following variations:
New HIGH record (1 month)
Type : Bullish
Timeframe : Weekly
Technical
A technical analysis in Daily of this ADOBE INC. chart shows a bullish trend. The signals returned by the moving averages are 75.00% bullish. This bullish trend is reinforced by the strong signals currently being given by short-term moving averages. There is no crossing of moving average by the price or crossing of moving averages between themselves.
The probability of a further increase is high given the direction of the technical indicators.
Caution: the Central Indicators scanner currently detects an excess:
RSI indicator is overbought : over 70
Type : Neutral
Timeframe : Daily
CCI indicator is overbought : over 100
Type : Neutral
Timeframe : Daily
CCI indicator: bearish divergence
Type : Bearish
Timeframe : Daily
Williams %R indicator is overbought : over -20
Type : Neutral
Timeframe : Daily
Pivot points : price is over resistance 1
Type : Neutral
Timeframe : Weekly
Price is back over the pivot point
Type : Bullish
Timeframe : Daily
The Central Patterns scanner, which studies chart patterns, resistances and supports, has identified these signals:
Near horizontal resistance
Type : Bearish
Timeframe : Daily
Resistance of channel is broken
Type : Bullish
Timeframe : Daily
For a small rebound in the very short term, the Central Candlesticks scanner currently notes the presence of this bullish pattern in Japanese candlesticks:
Three white soldiers
Type : Bullish
Timeframe : Daily
| S3 | S2 | S1 | Price | R1 | R2 | R3 | |
|---|---|---|---|---|---|---|---|
| ProTrendLines | 493.16 | 533.80 | 564.60 | 570.15 | 584.64 | 604.49 | 634.76 |
| Change (%) | -13.50% | -6.38% | -0.97% | - | +2.54% | +6.02% | +11.33% |
| Change | -76.99 | -36.35 | -5.55 | - | +14.49 | +34.34 | +64.61 |
| Level | Major | Major | Major | - | Minor | Minor | Major |
To determine price objectives, it is also possible to use the pivot points. Here is the price position in relation to pivot points:
| Pivot points | S3 | S2 | S1 | PP | R1 | R2 | R3 |
|---|---|---|---|---|---|---|---|
| Standard | 557.66 | 560.83 | 565.49 | 568.66 | 573.32 | 576.49 | 581.15 |
| Camarilla | 568.00 | 568.72 | 569.43 | 570.15 | 570.87 | 571.59 | 572.30 |
| Woodie | 558.41 | 561.20 | 566.24 | 569.03 | 574.07 | 576.86 | 581.90 |
| Fibonacci | 560.83 | 563.82 | 565.67 | 568.66 | 571.65 | 573.50 | 576.49 |
| Pivot points | S3 | S2 | S1 | PP | R1 | R2 | R3 |
|---|---|---|---|---|---|---|---|
| Standard | 496.12 | 509.18 | 532.36 | 545.42 | 568.60 | 581.66 | 604.84 |
| Camarilla | 545.57 | 548.90 | 552.22 | 555.54 | 558.86 | 562.18 | 565.51 |
| Woodie | 501.18 | 511.71 | 537.42 | 547.95 | 573.66 | 584.19 | 609.90 |
| Fibonacci | 509.18 | 523.02 | 531.58 | 545.42 | 559.26 | 567.82 | 581.66 |
| Pivot points | S3 | S2 | S1 | PP | R1 | R2 | R3 |
|---|---|---|---|---|---|---|---|
| Standard | 353.35 | 394.97 | 475.25 | 516.87 | 597.15 | 638.77 | 719.05 |
| Camarilla | 522.02 | 533.19 | 544.37 | 555.54 | 566.71 | 577.89 | 589.06 |
| Woodie | 372.69 | 404.64 | 494.59 | 526.54 | 616.49 | 648.44 | 738.39 |
| Fibonacci | 394.97 | 441.53 | 470.30 | 516.87 | 563.43 | 592.20 | 638.77 |
Numerical data
The following is the status of technical indicators and moving averages registered at the time this technical analysis was created:
| RSI (14): | 77.72 | |
| MACD (12,26,9): | 23.4500 | |
| Directional Movement: | 29.46 | |
| AROON (14): | 92.86 | |
| DEMA (21): | 550.23 | |
| Parabolic SAR (0,02-0,02-0,2): | 503.76 | |
| Elder Ray (13): | 31.35 | |
| Super Trend (3,10): | 527.94 | |
| Zig ZAG (10): | 570.15 | |
| VORTEX (21): | 1.1600 | |
| Stochastique (14,3,5): | 98.46 | |
| TEMA (21): | 569.14 | |
| Williams %R (14): | -1.42 | |
| Chande Momentum Oscillator (20): | 44.84 | |
| Repulse (5,40,3): | 4.0800 | |
| ROCnROLL: | 1 | |
| TRIX (15,9): | 0.5000 | |
| Courbe Coppock: | 35.63 |
| MA7: | 550.82 | |
| MA20: | 511.16 | |
| MA50: | 489.70 | |
| MA100: | 508.82 | |
| MAexp7: | 552.95 | |
| MAexp20: | 523.10 | |
| MAexp50: | 505.12 | |
| MAexp100: | 512.40 | |
| Price / MA7: | +3.51% | |
| Price / MA20: | +11.54% | |
| Price / MA50: | +16.43% | |
| Price / MA100: | +12.05% | |
| Price / MAexp7: | +3.11% | |
| Price / MAexp20: | +8.99% | |
| Price / MAexp50: | +12.87% | |
| Price / MAexp100: | +11.27% |
News
The latest news and videos published on ADOBE INC. at the time of the analysis were as follows:
- Readymag Nominated for the Webby Awards Alongside Adobe and Vimeo as the Best Digital Tool for Creative Production
- Adobe Announces Generative AI Solutions to Jumpstart Content Supply Chain for Enterprises
- Oshyn Introduces Reliability Report at Adobe Summit
-
 Look ahead: US producer prices; retail sales; Adobe; Dollar General
- Thinking about trading options or stock in Tesla, Coinbase Global, Adobe, Crowdstrike, or Meta Platforms?
About author

Online


Add a comment
Comments
0 comments on the analysis ADOBE INC. - Daily