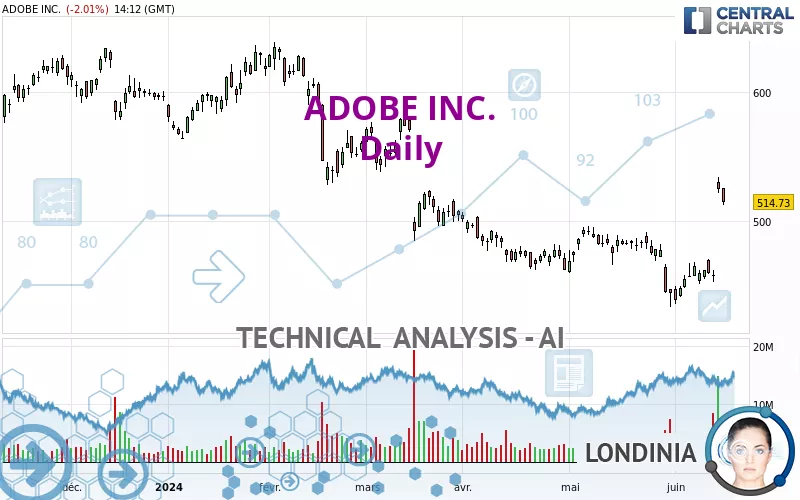
ADOBE INC. - Daily - Technical analysis published on 06/17/2024 (GMT)
- 200
- 0
Click here for a new analysis!
- Timeframe : Daily
- - Analysis generated on
- Status : TARGET REACHED
Summary of the analysis

Additional analysis
Quotes
The ADOBE INC. rating is 514.58 USD. The price is lower by -2.04% since the last closing and was traded between 512.34 USD and 525.94 USD over the period. The price is currently at +0.44% from its lowest and -2.16% from its highest.A study of price movements over other periods shows the following variations:
New HIGH record (1 month)
Type : Bullish
Timeframe : Weekly
Technical
A technical analysis in Daily of this ADOBE INC. chart shows a slightly bullish trend. 57.14% of the signals given by moving averages are bullish. This slightly bullish trend could be reinforced by the strong bullish signals given by short-term moving averages. An assessment of moving averages reveals several bearish and bullish signals:
Bullish trend reversal : Moving Average 20
Type : Bullish
Timeframe : Daily
Bullish trend reversal : Moving Average 50
Type : Bullish
Timeframe : Daily
Bullish trend reversal : adaptative moving average 20
Type : Bullish
Timeframe : Daily
Bullish trend reversal : adaptative moving average 50
Type : Bullish
Timeframe : Daily
Bullish trend reversal : adaptative moving average 100
Type : Bullish
Timeframe : Daily
Bearish price crossover with Moving Average 100
Type : Bearish
Timeframe : Daily
In fact, according to the parameters integrated into the Central Analyzer system, 14 technical indicators out of 18 analysed are currently bullish. But beware of excesses. The Central Indicators scanner currently detects this:
CCI indicator is overbought : over 100
Type : Neutral
Timeframe : Daily
Previous candle closed over Bollinger bands
Type : Neutral
Timeframe : Daily
Pivot points : price is under support 1
Type : Neutral
Timeframe : Daily
MACD indicator is back over 0
Type : Bullish
Timeframe : Daily
Central Patterns, the market scanner focusing on chart patterns, resistances and supports found these results:
Near horizontal resistance
Type : Bearish
Timeframe : Daily
Resistance of channel is broken
Type : Bullish
Timeframe : Daily
The Central Candlesticks scanner, specialised in Japanese candlesticks, did not identify any signals.
| S3 | S2 | S1 | Price | R1 | R2 | R3 | |
|---|---|---|---|---|---|---|---|
| ProTrendLines | 360.79 | 451.02 | 493.16 | 514.58 | 533.80 | 564.62 | 634.54 |
| Change (%) | -29.89% | -12.35% | -4.16% | - | +3.74% | +9.72% | +23.31% |
| Change | -153.79 | -63.56 | -21.42 | - | +19.22 | +50.04 | +119.96 |
| Level | Minor | Major | Major | - | Major | Minor | Major |
Attention could also be paid to pivot points to set price objectives:
| Pivot points | S3 | S2 | S1 | PP | R1 | R2 | R3 |
|---|---|---|---|---|---|---|---|
| Standard | 507.41 | 514.64 | 519.98 | 527.21 | 532.55 | 539.78 | 545.12 |
| Camarilla | 521.85 | 523.01 | 524.16 | 525.31 | 526.46 | 527.62 | 528.77 |
| Woodie | 506.46 | 514.17 | 519.03 | 526.74 | 531.60 | 539.31 | 544.17 |
| Fibonacci | 514.64 | 519.45 | 522.41 | 527.21 | 532.02 | 534.98 | 539.78 |
| Pivot points | S3 | S2 | S1 | PP | R1 | R2 | R3 |
|---|---|---|---|---|---|---|---|
| Standard | 390.12 | 420.82 | 473.06 | 503.76 | 556.00 | 586.70 | 638.94 |
| Camarilla | 502.50 | 510.10 | 517.71 | 525.31 | 532.91 | 540.52 | 548.12 |
| Woodie | 400.90 | 426.21 | 483.84 | 509.15 | 566.78 | 592.09 | 649.72 |
| Fibonacci | 420.82 | 452.50 | 472.07 | 503.76 | 535.44 | 555.01 | 586.70 |
| Pivot points | S3 | S2 | S1 | PP | R1 | R2 | R3 |
|---|---|---|---|---|---|---|---|
| Standard | 357.44 | 395.71 | 420.23 | 458.50 | 483.02 | 521.29 | 545.81 |
| Camarilla | 427.49 | 433.25 | 439.00 | 444.76 | 450.52 | 456.27 | 462.03 |
| Woodie | 350.58 | 392.27 | 413.37 | 455.06 | 476.16 | 517.85 | 538.95 |
| Fibonacci | 395.71 | 419.69 | 434.51 | 458.50 | 482.48 | 497.30 | 521.29 |
Numerical data
The following is the status of the technical indicators and moving averages at the time of publication of this technical analysis:
| RSI (14): | 66.41 | |
| MACD (12,26,9): | 2.8500 | |
| Directional Movement: | 21.92 | |
| AROON (14): | 71.43 | |
| DEMA (21): | 475.11 | |
| Parabolic SAR (0,02-0,02-0,2): | 439.40 | |
| Elder Ray (13): | 42.36 | |
| Super Trend (3,10): | 474.66 | |
| Zig ZAG (10): | 514.39 | |
| VORTEX (21): | 0.8800 | |
| Stochastique (14,3,5): | 73.47 | |
| TEMA (21): | 483.99 | |
| Williams %R (14): | -19.27 | |
| Chande Momentum Oscillator (20): | 69.41 | |
| Repulse (5,40,3): | -3.1900 | |
| ROCnROLL: | 1 | |
| TRIX (15,9): | -0.1300 | |
| Courbe Coppock: | 3.11 |
| MA7: | 478.13 | |
| MA20: | 470.27 | |
| MA50: | 475.44 | |
| MA100: | 517.66 | |
| MAexp7: | 485.72 | |
| MAexp20: | 474.80 | |
| MAexp50: | 483.63 | |
| MAexp100: | 504.95 | |
| Price / MA7: | +7.62% | |
| Price / MA20: | +9.42% | |
| Price / MA50: | +8.23% | |
| Price / MA100: | -0.59% | |
| Price / MAexp7: | +5.94% | |
| Price / MAexp20: | +8.38% | |
| Price / MAexp50: | +6.40% | |
| Price / MAexp100: | +1.91% |
News
The latest news and videos published on ADOBE INC. at the time of the analysis were as follows:
- Readymag Nominated for the Webby Awards Alongside Adobe and Vimeo as the Best Digital Tool for Creative Production
- Adobe Announces Generative AI Solutions to Jumpstart Content Supply Chain for Enterprises
- Oshyn Introduces Reliability Report at Adobe Summit
-
 Look ahead: US producer prices; retail sales; Adobe; Dollar General
- Thinking about trading options or stock in Tesla, Coinbase Global, Adobe, Crowdstrike, or Meta Platforms?
About author

Online


Add a comment
Comments
0 comments on the analysis ADOBE INC. - Daily