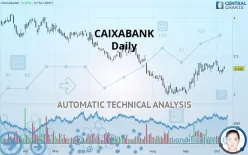
CAIXABANK - Daily - Technical analysis published on 10/08/2019 (GMT)
- 309
- 0
- Who voted?
- Timeframe : Daily
- - Analysis generated on
- Status : NEUTRAL

Summary of the analysis

Additional analysis
Quotes
CAIXABANK rating 2.332 EUR. The price has increased by +0.26% since the last closing and was between 2.325 EUR and 2.360 EUR. This implies that the price is at +0.30% from its lowest and at -1.19% from its highest.The Central Gaps scanner detects a bullish gap which is a sign that buyers have taken the lead in the very short term.
Opening Gap UP
Type : Bullish
Timeframe : Openning
So that you have an overall view of the price change, here is a table showing the variations over several periods:
Near a new HIGH record (1 month)
Type : Bullish
Timeframe : Weekly
Technical
A technical analysis in Daily of this CAIXABANK chart shows a neutral trend. This indecision could turn into a bullish trend due to the bullish signals currently being given by short-term moving averages. An assessment of moving averages reveals several bullish signals that could impact this trend:
Bullish trend reversal : adaptative moving average 20
Type : Bullish
Timeframe : Daily
Bullish price crossover with adaptative moving average 20
Type : Bullish
Timeframe : Daily
Bullish price crossover with adaptative moving average 100
Type : Bullish
Timeframe : Daily
In fact, Central Analyzer took into account 18 technical indicators and the result was as follows: 3 are bullish, 9 are neutral and 6 are bearish. Central Indicators, the scanner specialised in technical indicators, has identified these signals:
RSI indicator is back over 50
Type : Bullish
Timeframe : Daily
Ichimoku : price is over the cloud
Type : Bullish
Timeframe : Daily
Price is back over the pivot point
Type : Bullish
Timeframe : Daily
Price is back under the pivot point
Type : Bearish
Timeframe : Weekly
An analysis of the price chart with the Central Patterns scanner (detector of chart patterns and resistances and supports) shows several results that can have an impact on the price change:
Near horizontal support
Type : Bullish
Timeframe : Daily
Support of channel is broken
Type : Bearish
Timeframe : Daily
The Central Candlesticks scanner which studies Japanese candlesticks did not detect anything.
| S3 | S2 | S1 | Price | R1 | R2 | R3 | |
|---|---|---|---|---|---|---|---|
| ProTrendLines | 1.894 | 2.005 | 2.213 | 2.332 | 2.405 | 2.662 | 2.886 |
| Change (%) | -18.78% | -14.02% | -5.10% | - | +3.13% | +14.15% | +23.76% |
| Change | -0.438 | -0.327 | -0.119 | - | +0.073 | +0.330 | +0.554 |
| Level | Major | Major | Major | - | Major | Minor | Intermediate |
Pivot points can also be used to set your price objectives. Here is the price situation in relation to pivot points:
| Pivot points | S3 | S2 | S1 | PP | R1 | R2 | R3 |
|---|---|---|---|---|---|---|---|
| Standard | 2.213 | 2.238 | 2.282 | 2.307 | 2.351 | 2.376 | 2.420 |
| Camarilla | 2.307 | 2.313 | 2.320 | 2.326 | 2.332 | 2.339 | 2.345 |
| Woodie | 2.223 | 2.243 | 2.292 | 2.312 | 2.361 | 2.381 | 2.430 |
| Fibonacci | 2.238 | 2.264 | 2.281 | 2.307 | 2.333 | 2.350 | 2.376 |
| Pivot points | S3 | S2 | S1 | PP | R1 | R2 | R3 |
|---|---|---|---|---|---|---|---|
| Standard | 2.023 | 2.139 | 2.213 | 2.329 | 2.403 | 2.519 | 2.593 |
| Camarilla | 2.234 | 2.251 | 2.269 | 2.286 | 2.303 | 2.321 | 2.338 |
| Woodie | 2.001 | 2.129 | 2.191 | 2.319 | 2.381 | 2.509 | 2.571 |
| Fibonacci | 2.139 | 2.212 | 2.257 | 2.329 | 2.402 | 2.447 | 2.519 |
| Pivot points | S3 | S2 | S1 | PP | R1 | R2 | R3 |
|---|---|---|---|---|---|---|---|
| Standard | 1.666 | 1.828 | 2.119 | 2.281 | 2.572 | 2.734 | 3.025 |
| Camarilla | 2.285 | 2.327 | 2.369 | 2.410 | 2.452 | 2.493 | 2.535 |
| Woodie | 1.731 | 1.860 | 2.184 | 2.313 | 2.637 | 2.766 | 3.090 |
| Fibonacci | 1.828 | 2.001 | 2.108 | 2.281 | 2.454 | 2.561 | 2.734 |
Numerical data
The following is the status of the technical indicators and moving averages at the time of publication of this technical analysis:
| RSI (14): | 54.45 | |
| MACD (12,26,9): | 0.0310 | |
| Directional Movement: | -0.288 | |
| AROON (14): | -14.285 | |
| DEMA (21): | 2.357 | |
| Parabolic SAR (0,02-0,02-0,2): | 2.424 | |
| Elder Ray (13): | 0.015 | |
| Super Trend (3,10): | 2.206 | |
| Zig ZAG (10): | 2.335 | |
| VORTEX (21): | 1.1010 | |
| Stochastique (14,3,5): | 30.53 | |
| TEMA (21): | 2.374 | |
| Williams %R (14): | -61.05 | |
| Chande Momentum Oscillator (20): | -0.069 | |
| Repulse (5,40,3): | -0.8170 | |
| ROCnROLL: | 1 | |
| TRIX (15,9): | 0.3130 | |
| Courbe Coppock: | 0.90 |
| MA7: | 2.332 | |
| MA20: | 2.342 | |
| MA50: | 2.205 | |
| MA100: | 2.387 | |
| MAexp7: | 2.329 | |
| MAexp20: | 2.312 | |
| MAexp50: | 2.297 | |
| MAexp100: | 2.399 | |
| Price / MA7: | -0% | |
| Price / MA20: | -0.43% | |
| Price / MA50: | +5.76% | |
| Price / MA100: | -2.30% | |
| Price / MAexp7: | +0.13% | |
| Price / MAexp20: | +0.87% | |
| Price / MAexp50: | +1.52% | |
| Price / MAexp100: | -2.79% |
News
The latest news and videos published on CAIXABANK at the time of the analysis were as follows:
- CAIXA's Net Income grows 22% to R$4.2 bi in 2Q19
- Caixa Reports Recurrent Net Income Record of R$12.7 Billion in 2018, 40% Over 2017
- CAIXA Commits to IBM Z Following Unprecedented Growth
- CAIXA JCB Unico Card Launch in Brazil
-
 Spain’s Caixabank and Gas Natural quit Catalonia
About author

Online


Add a comment
Comments
0 comments on the analysis CAIXABANK - Daily