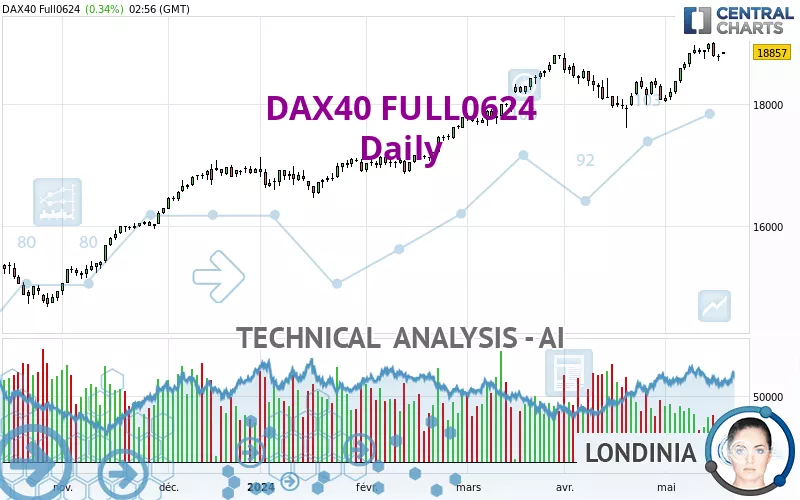
DAX40 FULL0625 - Daily - Technical analysis published on 05/20/2024 (GMT)
- 112
- 0
Click here for a new analysis!
- Timeframe : Daily
- - Analysis generated on
- Status : LEVEL MAINTAINED

Summary of the analysis

Additional analysis
Quotes
DAX40 FULL0624 rating 18,857.00 EUR. On the day, this instrument gained +0.34% with the lowest point at 18,817.00 EUR and the highest point at 18,859.00 EUR. The deviation from the price is +0.21% for the low point and -0.01% for the high point.A bullish gap was detected at the opening by the Central Gaps scanner. There are a lot of buyers and they have the upper hand in the very short term.
Opening Gap UP
Type : Bullish
Timeframe : Openning
A study of price movements over other periods shows the following variations:
Near a new HIGH record (5 years)
Type : Bullish
Timeframe : Weekly
Near a new HIGH record (1 year)
Type : Bullish
Timeframe : Weekly
Near a new HIGH record (1st january)
Type : Bullish
Timeframe : Weekly
Near a new HIGH record (1 month)
Type : Bullish
Timeframe : Weekly
Technical
Technical analysis of this Daily chart of DAX40 FULL0624 indicates that the overall trend is strongly bullish. 92.86% of the signals given by moving averages are bullish. This strongly bullish trend is supported by the strong bullish signals given by short-term moving averages. The Central Indicators market scanner currently does not detect any result that concerns moving averages.
The probability of a further increase are moderate given the direction of the technical indicators.
Caution: the Central Indicators scanner currently detects an excess:
Williams %R indicator is overbought : over -20
Type : Neutral
Timeframe : Daily
Pivot points : price is over resistance 1
Type : Neutral
Timeframe : Daily
Price is back over the pivot point
Type : Bullish
Timeframe : Weekly
Central Patterns, the scanner specializing in chart patterns, did not identify any signals.
For a small rebound in the very short term, the Central Candlesticks scanner currently notes the presence of these bullish patterns in Japanese candlesticks:
White morning star
Type : Bullish
Timeframe : Daily
Upside gap
Type : Bullish
Timeframe : Daily
| S3 | S2 | S1 | Price | |
|---|---|---|---|---|
| ProTrendLines | 17,247.40 | 18,068.11 | 18,812.00 | 18,857.00 |
| Change (%) | -8.54% | -4.18% | -0.24% | - |
| Change | -1,609.60 | -788.89 | -45.00 | - |
| Level | Major | Intermediate | Major | - |
Attention could also be paid to pivot points to set price objectives:
| Pivot points | S3 | S2 | S1 | PP | R1 | R2 | R3 |
|---|---|---|---|---|---|---|---|
| Standard | 18,623.33 | 18,665.67 | 18,729.33 | 18,771.67 | 18,835.33 | 18,877.67 | 18,941.33 |
| Camarilla | 18,763.85 | 18,773.57 | 18,783.28 | 18,793.00 | 18,802.72 | 18,812.43 | 18,822.15 |
| Woodie | 18,634.00 | 18,671.00 | 18,740.00 | 18,777.00 | 18,846.00 | 18,883.00 | 18,952.00 |
| Fibonacci | 18,665.67 | 18,706.16 | 18,731.18 | 18,771.67 | 18,812.16 | 18,837.18 | 18,877.67 |
| Pivot points | S3 | S2 | S1 | PP | R1 | R2 | R3 |
|---|---|---|---|---|---|---|---|
| Standard | 18,351.33 | 18,529.67 | 18,661.33 | 18,839.67 | 18,971.33 | 19,149.67 | 19,281.33 |
| Camarilla | 18,707.75 | 18,736.17 | 18,764.58 | 18,793.00 | 18,821.42 | 18,849.83 | 18,878.25 |
| Woodie | 18,328.00 | 18,518.00 | 18,638.00 | 18,828.00 | 18,948.00 | 19,138.00 | 19,258.00 |
| Fibonacci | 18,529.67 | 18,648.09 | 18,721.25 | 18,839.67 | 18,958.09 | 19,031.25 | 19,149.67 |
| Pivot points | S3 | S2 | S1 | PP | R1 | R2 | R3 |
|---|---|---|---|---|---|---|---|
| Standard | 16,273.33 | 16,940.67 | 17,504.33 | 18,171.67 | 18,735.33 | 19,402.67 | 19,966.33 |
| Camarilla | 17,729.48 | 17,842.32 | 17,955.16 | 18,068.00 | 18,180.84 | 18,293.68 | 18,406.53 |
| Woodie | 16,221.50 | 16,914.75 | 17,452.50 | 18,145.75 | 18,683.50 | 19,376.75 | 19,914.50 |
| Fibonacci | 16,940.67 | 17,410.91 | 17,701.43 | 18,171.67 | 18,641.91 | 18,932.43 | 19,402.67 |
Numerical data
The following is the status of technical indicators and moving averages registered at the time this technical analysis was created:
| RSI (14): | 62.24 | |
| MACD (12,26,9): | 175.8000 | |
| Directional Movement: | 10.07 | |
| AROON (14): | 71.42 | |
| DEMA (21): | 18,816.78 | |
| Parabolic SAR (0,02-0,02-0,2): | 18,699.02 | |
| Elder Ray (13): | 131.33 | |
| Super Trend (3,10): | 18,372.90 | |
| Zig ZAG (10): | 18,850.00 | |
| VORTEX (21): | 1.2000 | |
| Stochastique (14,3,5): | 79.80 | |
| TEMA (21): | 18,903.07 | |
| Williams %R (14): | -17.06 | |
| Chande Momentum Oscillator (20): | 753.00 | |
| Repulse (5,40,3): | 0.3300 | |
| ROCnROLL: | 1 | |
| TRIX (15,9): | 0.1000 | |
| Courbe Coppock: | 7.07 |
| MA7: | 18,867.57 | |
| MA20: | 18,522.45 | |
| MA50: | 18,402.70 | |
| MA100: | 17,880.33 | |
| MAexp7: | 18,809.69 | |
| MAexp20: | 18,606.21 | |
| MAexp50: | 18,334.42 | |
| MAexp100: | 17,944.64 | |
| Price / MA7: | -0.06% | |
| Price / MA20: | +1.81% | |
| Price / MA50: | +2.47% | |
| Price / MA100: | +5.46% | |
| Price / MAexp7: | +0.25% | |
| Price / MAexp20: | +1.35% | |
| Price / MAexp50: | +2.85% | |
| Price / MAexp100: | +5.08% |
About author

Online


Add a comment
Comments
0 comments on the analysis DAX40 FULL0625 - Daily