DAX40 FULL0925 - Weekly - Technical analysis published on 01/14/2023 (GMT)
- 174
- 0
Click here for a new analysis!
- Timeframe : Weekly
- - Analysis generated on
- Status : TARGET REACHED
Summary of the analysis

Additional analysis
Quotes
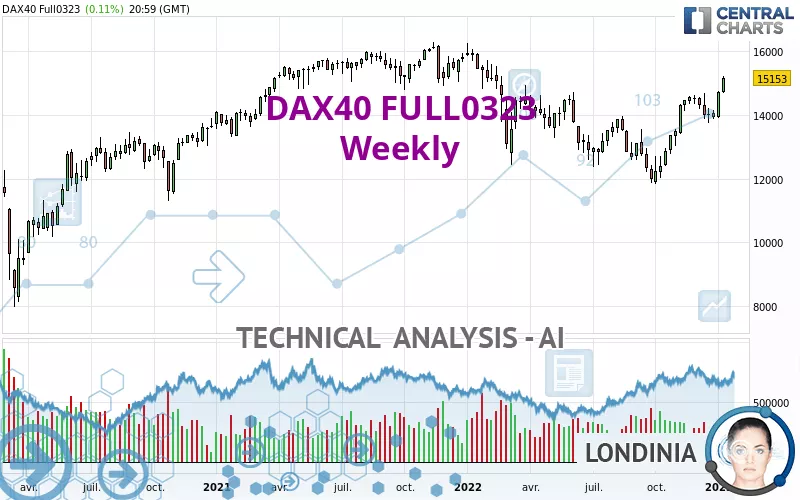
The DAX40 FULL0323 price is 15,153.00 EUR. Over 5 days, this instrument gained +2.88% with the lowest point at 14,739.00 EUR and the highest point at 15,213.00 EUR. The deviation from the price is +2.81% for the low point and -0.39% for the high point.The Central Gaps scanner detects a bullish opening. A small advantage for buyers in the very short term.
Bullish opening
Type : Bullish
Timeframe : Openning
Here is a more detailed summary of the historical variations registered by DAX40 FULL0323:
Near a new HIGH record (1 year)
Type : Bullish
Timeframe : Weekly
New HIGH record (1st january)
Type : Bullish
Timeframe : Weekly
New HIGH record (1 month)
Type : Bullish
Timeframe : Weekly
Technical
A technical analysis in Weekly of this DAX40 FULL0323 chart shows a bullish trend. The signals returned by the moving averages are 64.29% bullish. This bullish trend is reinforced by the strong signals currently being given by short-term moving averages. There is no crossing of moving average by the price or crossing of moving averages between themselves.
In fact, 16 technical indicators on 18 studied are currently positioned bullish. But beware of excesses. The Central Indicators scanner currently detects this:
CCI indicator is overbought : over 100
Type : Neutral
Timeframe : Weekly
Williams %R indicator is overbought : over -20
Type : Neutral
Timeframe : Weekly
Pivot points : price is over resistance 1
Type : Neutral
Timeframe : Weekly
No signals are given by Central Patterns, a market scanner specialised in chart patterns, resistances and supports.
No result was found by the Central Candlesticks scanner on Japanese candlesticks.
| S3 | S2 | S1 | Price | R1 | |
|---|---|---|---|---|---|
| ProTrendLines | 12,622.60 | 13,760.00 | 15,098.00 | 15,153.00 | 16,320.00 |
| Change (%) | -16.70% | -9.19% | -0.36% | - | +7.70% |
| Change | -2,530.40 | -1,393.00 | -55.00 | - | +1,167.00 |
| Level | Major | Major | Major | - | Major |
Attention could also be paid to pivot points to set price objectives:
| Pivot points | S3 | S2 | S1 | PP | R1 | R2 | R3 |
|---|---|---|---|---|---|---|---|
| Standard | 14,981.33 | 15,039.67 | 15,096.33 | 15,154.67 | 15,211.33 | 15,269.67 | 15,326.33 |
| Camarilla | 15,121.38 | 15,131.92 | 15,142.46 | 15,153.00 | 15,163.54 | 15,174.08 | 15,184.63 |
| Woodie | 14,980.50 | 15,039.25 | 15,095.50 | 15,154.25 | 15,210.50 | 15,269.25 | 15,325.50 |
| Fibonacci | 15,039.67 | 15,083.60 | 15,110.74 | 15,154.67 | 15,198.60 | 15,225.74 | 15,269.67 |
| Pivot points | S3 | S2 | S1 | PP | R1 | R2 | R3 |
|---|---|---|---|---|---|---|---|
| Standard | 13,289.67 | 13,596.33 | 14,130.67 | 14,437.33 | 14,971.67 | 15,278.33 | 15,812.67 |
| Camarilla | 14,433.73 | 14,510.82 | 14,587.91 | 14,665.00 | 14,742.09 | 14,819.18 | 14,896.28 |
| Woodie | 13,403.50 | 13,653.25 | 14,244.50 | 14,494.25 | 15,085.50 | 15,335.25 | 15,926.50 |
| Fibonacci | 13,596.33 | 13,917.60 | 14,116.07 | 14,437.33 | 14,758.60 | 14,957.07 | 15,278.33 |
| Pivot points | S3 | S2 | S1 | PP | R1 | R2 | R3 |
|---|---|---|---|---|---|---|---|
| Standard | 12,557.67 | 13,161.33 | 13,544.67 | 14,148.33 | 14,531.67 | 15,135.33 | 15,518.67 |
| Camarilla | 13,656.58 | 13,747.05 | 13,837.53 | 13,928.00 | 14,018.48 | 14,108.95 | 14,199.43 |
| Woodie | 12,447.50 | 13,106.25 | 13,434.50 | 14,093.25 | 14,421.50 | 15,080.25 | 15,408.50 |
| Fibonacci | 13,161.33 | 13,538.37 | 13,771.30 | 14,148.33 | 14,525.37 | 14,758.30 | 15,135.33 |
Numerical data
The following is the status of technical indicators and moving averages registered at the time this technical analysis was created:
| RSI (14): | 65.12 | |
| MACD (12,26,9): | 272.1900 | |
| Directional Movement: | 13.91 | |
| AROON (14): | 100.00 | |
| DEMA (21): | 14,237.07 | |
| Parabolic SAR (0,02-0,02-0,2): | 13,819.24 | |
| Elder Ray (13): | 785.17 | |
| Super Trend (3,10): | 13,254.95 | |
| Zig ZAG (10): | 15,153.00 | |
| VORTEX (21): | 1.0800 | |
| Stochastique (14,3,5): | 88.72 | |
| TEMA (21): | 14,673.50 | |
| Williams %R (14): | -1.92 | |
| Chande Momentum Oscillator (20): | 2,212.00 | |
| Repulse (5,40,3): | 6.6900 | |
| ROCnROLL: | 1 | |
| TRIX (15,9): | 0.1000 | |
| Courbe Coppock: | 27.45 |
| MA7: | 14,882.00 | |
| MA20: | 14,361.10 | |
| MA50: | 14,351.52 | |
| MA100: | 13,584.75 | |
| MAexp7: | 14,443.15 | |
| MAexp20: | 13,986.71 | |
| MAexp50: | 13,997.79 | |
| MAexp100: | 14,032.99 | |
| Price / MA7: | +1.82% | |
| Price / MA20: | +5.51% | |
| Price / MA50: | +5.58% | |
| Price / MA100: | +11.54% | |
| Price / MAexp7: | +4.91% | |
| Price / MAexp20: | +8.34% | |
| Price / MAexp50: | +8.25% | |
| Price / MAexp100: | +7.98% |
About author

Online


Add a comment
Comments
0 comments on the analysis DAX40 FULL0925 - Weekly