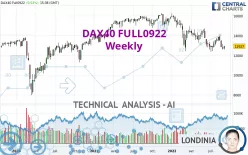
DAX40 FULL0925 - Weekly - Technical analysis published on 09/07/2022 (GMT)
- 156
- 0
Click here for a new analysis!
- Timeframe : Weekly
- - Analysis generated on
- Status : INVALID

Summary of the analysis

Additional analysis
Quotes
The DAX40 FULL0922 rating is 12,927.00 EUR. The price registered an increase of +0.89% over 5 days with the lowest point at 12,593.00 EUR and the highest point at 12,959.00 EUR. The deviation from the price is +2.65% for the low point and -0.25% for the high point.The Central Gaps scanner detects a bearish opening marking the presence of sellers ahead of buyers at the opening but not sufficiently marked to allow the price to register a quotation gap.
Bearish opening
Type : Bearish
Timeframe : Openning
A study of price movements over other periods shows the following variations:
Near a new LOW record (1 year)
Type : Bearish
Timeframe : Weekly
Near a new LOW record (1st january)
Type : Bearish
Timeframe : Weekly
Near a new LOW record (1 month)
Type : Bearish
Timeframe : Weekly
Technical
Technical analysis of DAX40 FULL0922 in Weekly shows a overall strongly bearish trend. 92.86% of the signals given by moving averages are bearish. The overall trend is supported by the strong bearish signals from short-term moving averages. The Central Indicators scanner detects a bearish signal on moving averages that could impact this trend:
Moving Average bearish crossovers : MA50 & MA100
Type : Bearish
Timeframe : Weekly
An assessment of technical indicators does not currently provide any relevant information on the direction of future price movements.
Central Indicators, the scanner specialised in technical indicators, has identified this signal:
Price is back over the pivot point
Type : Bullish
Timeframe : Weekly
No signals are given by Central Patterns, a market scanner specialised in chart patterns, resistances and supports.
The Central Candlesticks scanner, specialised in Japanese candlesticks, did not identify any signals.
| S3 | S2 | S1 | Price | R1 | R2 | R3 | |
|---|---|---|---|---|---|---|---|
| ProTrendLines | 10,291.70 | 11,480.30 | 12,284.50 | 12,927.00 | 13,655.00 | 14,993.00 | 16,215.00 |
| Change (%) | -20.39% | -11.19% | -4.97% | - | +5.63% | +15.98% | +25.44% |
| Change | -2,635.30 | -1,446.70 | -642.50 | - | +728.00 | +2,066.00 | +3,288.00 |
| Level | Intermediate | Minor | Intermediate | - | Major | Major | Major |
Attention could also be paid to pivot points to set price objectives:
| Pivot points | S3 | S2 | S1 | PP | R1 | R2 | R3 |
|---|---|---|---|---|---|---|---|
| Standard | 12,535.67 | 12,628.33 | 12,743.67 | 12,836.33 | 12,951.67 | 13,044.33 | 13,159.67 |
| Camarilla | 12,801.80 | 12,820.87 | 12,839.93 | 12,859.00 | 12,878.07 | 12,897.13 | 12,916.20 |
| Woodie | 12,547.00 | 12,634.00 | 12,755.00 | 12,842.00 | 12,963.00 | 13,050.00 | 13,171.00 |
| Fibonacci | 12,628.33 | 12,707.79 | 12,756.88 | 12,836.33 | 12,915.79 | 12,964.88 | 13,044.33 |
| Pivot points | S3 | S2 | S1 | PP | R1 | R2 | R3 |
|---|---|---|---|---|---|---|---|
| Standard | 12,151.33 | 12,374.67 | 12,708.33 | 12,931.67 | 13,265.33 | 13,488.67 | 13,822.33 |
| Camarilla | 12,888.83 | 12,939.88 | 12,990.94 | 13,042.00 | 13,093.06 | 13,144.12 | 13,195.18 |
| Woodie | 12,206.50 | 12,402.25 | 12,763.50 | 12,959.25 | 13,320.50 | 13,516.25 | 13,877.50 |
| Fibonacci | 12,374.67 | 12,587.44 | 12,718.89 | 12,931.67 | 13,144.44 | 13,275.89 | 13,488.67 |
| Pivot points | S3 | S2 | S1 | PP | R1 | R2 | R3 |
|---|---|---|---|---|---|---|---|
| Standard | 11,083.67 | 11,892.33 | 12,352.67 | 13,161.33 | 13,621.67 | 14,430.33 | 14,890.67 |
| Camarilla | 12,464.03 | 12,580.35 | 12,696.68 | 12,813.00 | 12,929.33 | 13,045.65 | 13,161.98 |
| Woodie | 10,909.50 | 11,805.25 | 12,178.50 | 13,074.25 | 13,447.50 | 14,343.25 | 14,716.50 |
| Fibonacci | 11,892.33 | 12,377.09 | 12,676.58 | 13,161.33 | 13,646.09 | 13,945.58 | 14,430.33 |
Numerical data
The following are the details of the technical indicators and moving averages that were collected to generate this technical analysis:
| RSI (14): | 39.52 | |
| MACD (12,26,9): | -364.1300 | |
| Directional Movement: | -14.38 | |
| AROON (14): | -28.57 | |
| DEMA (21): | 13,015.64 | |
| Parabolic SAR (0,02-0,02-0,2): | 13,935.91 | |
| Elder Ray (13): | -556.85 | |
| Super Trend (3,10): | 14,552.75 | |
| Zig ZAG (10): | 12,935.00 | |
| VORTEX (21): | 0.9000 | |
| Stochastique (14,3,5): | 25.00 | |
| TEMA (21): | 12,964.70 | |
| Williams %R (14): | -75.29 | |
| Chande Momentum Oscillator (20): | -198.00 | |
| Repulse (5,40,3): | 1.9600 | |
| ROCnROLL: | 2 | |
| TRIX (15,9): | -0.4000 | |
| Courbe Coppock: | 10.00 |
| MA7: | 12,850.57 | |
| MA20: | 13,239.65 | |
| MA50: | 13,178.88 | |
| MA100: | 13,498.22 | |
| MAexp7: | 13,187.25 | |
| MAexp20: | 13,518.11 | |
| MAexp50: | 14,056.17 | |
| MAexp100: | 14,062.92 | |
| Price / MA7: | +0.59% | |
| Price / MA20: | -2.36% | |
| Price / MA50: | -1.91% | |
| Price / MA100: | -4.23% | |
| Price / MAexp7: | -1.97% | |
| Price / MAexp20: | -4.37% | |
| Price / MAexp50: | -8.03% | |
| Price / MAexp100: | -8.08% |
About author

Online


Add a comment
Comments
0 comments on the analysis DAX40 FULL0925 - Weekly