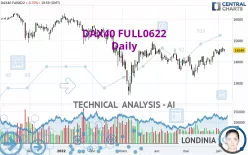
DAX40 FULL0625 - Daily - Technical analysis published on 06/07/2022 (GMT)
- 211
- 0
Click here for a new analysis!
- Timeframe : Daily
- - Analysis generated on
- Status : INVALID
Summary of the analysis

Additional analysis
Quotes
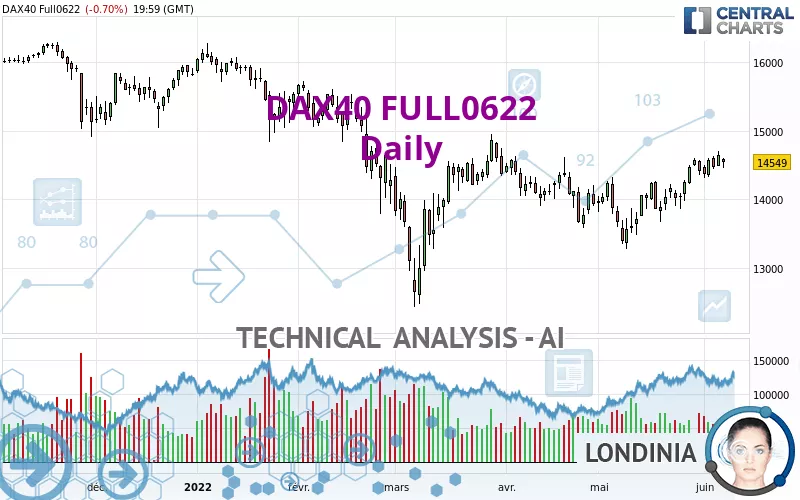
The DAX40 FULL0622 price is 14,549.00 EUR. On the day, this instrument lost -0.70% and was between 14,452.00 EUR and 14,604.00 EUR. This implies that the price is at +0.67% from its lowest and at -0.38% from its highest.The Central Gaps scanner detects a bearish opening. A small advantage for sellers in the very short term.
Bearish opening
Type : Bearish
Timeframe : Openning
Here is a more detailed summary of the historical variations registered by DAX40 FULL0622:
Near a new HIGH record (1 month)
Type : Bullish
Timeframe : Weekly
Technical
Technical analysis of DAX40 FULL0622 in Daily shows an overall bullish trend. 67.86% of the signals given by moving averages are bullish. This bullish trend is supported by the strong bullish signals given by short-term moving averages. An assessment of moving averages reveals several bearish and bullish signals:
Moving Average bullish crossovers : MA20 & MA50
Type : Bullish
Timeframe : Daily
Bearish price crossover with adaptative moving average 100
Type : Bearish
Timeframe : Daily
The probability of a further increase is high given the direction of the technical indicators.
Caution: the Central Indicators scanner currently detects an excess:
CCI indicator: bearish divergence
Type : Bearish
Timeframe : Daily
RSI indicator: bearish divergence
Type : Bearish
Timeframe : Daily
Williams %R indicator is overbought : over -20
Type : Neutral
Timeframe : Daily
No signals are given by Central Patterns, a market scanner specialised in chart patterns, resistances and supports.
The presence of a bearish pattern in Japanese candlesticks detected by Central Candlesticks that could cause a correction in the very short term was also detected:
Bearish harami
Type : Bearish
Timeframe : Daily
| S3 | S2 | S1 | Price | R1 | R2 | R3 | |
|---|---|---|---|---|---|---|---|
| ProTrendLines | 13,690.00 | 14,230.00 | 14,516.50 | 14,549.00 | 15,028.00 | 15,899.40 | 16,250.00 |
| Change (%) | -5.90% | -2.19% | -0.22% | - | +3.29% | +9.28% | +11.69% |
| Change | -859.00 | -319.00 | -32.50 | - | +479.00 | +1,350.40 | +1,701.00 |
| Level | Major | Intermediate | Intermediate | - | Major | Minor | Major |
Pivot points can also be used to set your price objectives. Here is the price situation in relation to pivot points:
| Pivot points | S3 | S2 | S1 | PP | R1 | R2 | R3 |
|---|---|---|---|---|---|---|---|
| Standard | 14,314.00 | 14,383.00 | 14,466.00 | 14,535.00 | 14,618.00 | 14,687.00 | 14,770.00 |
| Camarilla | 14,507.20 | 14,521.13 | 14,535.07 | 14,549.00 | 14,562.93 | 14,576.87 | 14,590.80 |
| Woodie | 14,321.00 | 14,386.50 | 14,473.00 | 14,538.50 | 14,625.00 | 14,690.50 | 14,777.00 |
| Fibonacci | 14,383.00 | 14,441.06 | 14,476.94 | 14,535.00 | 14,593.06 | 14,628.94 | 14,687.00 |
| Pivot points | S3 | S2 | S1 | PP | R1 | R2 | R3 |
|---|---|---|---|---|---|---|---|
| Standard | 13,955.00 | 14,130.00 | 14,287.00 | 14,462.00 | 14,619.00 | 14,794.00 | 14,951.00 |
| Camarilla | 14,352.70 | 14,383.13 | 14,413.57 | 14,444.00 | 14,474.43 | 14,504.87 | 14,535.30 |
| Woodie | 13,946.00 | 14,125.50 | 14,278.00 | 14,457.50 | 14,610.00 | 14,789.50 | 14,942.00 |
| Fibonacci | 14,130.00 | 14,256.82 | 14,335.18 | 14,462.00 | 14,588.82 | 14,667.18 | 14,794.00 |
| Pivot points | S3 | S2 | S1 | PP | R1 | R2 | R3 |
|---|---|---|---|---|---|---|---|
| Standard | 12,260.67 | 12,766.33 | 13,590.67 | 14,096.33 | 14,920.67 | 15,426.33 | 16,250.67 |
| Camarilla | 14,049.25 | 14,171.17 | 14,293.08 | 14,415.00 | 14,536.92 | 14,658.83 | 14,780.75 |
| Woodie | 12,420.00 | 12,846.00 | 13,750.00 | 14,176.00 | 15,080.00 | 15,506.00 | 16,410.00 |
| Fibonacci | 12,766.33 | 13,274.39 | 13,588.27 | 14,096.33 | 14,604.39 | 14,918.27 | 15,426.33 |
Numerical data
The following are the details of the technical indicators and moving averages that were collected to generate this technical analysis:
| RSI (14): | 58.37 | |
| MACD (12,26,9): | 142.9700 | |
| Directional Movement: | 7.03 | |
| AROON (14): | 85.72 | |
| DEMA (21): | 14,433.03 | |
| Parabolic SAR (0,02-0,02-0,2): | 14,254.86 | |
| Elder Ray (13): | 164.53 | |
| Super Trend (3,10): | 13,803.51 | |
| Zig ZAG (10): | 14,549.00 | |
| VORTEX (21): | 1.1600 | |
| Stochastique (14,3,5): | 86.37 | |
| TEMA (21): | 14,588.16 | |
| Williams %R (14): | -15.41 | |
| Chande Momentum Oscillator (20): | 514.00 | |
| Repulse (5,40,3): | 0.3400 | |
| ROCnROLL: | 1 | |
| TRIX (15,9): | 0.0900 | |
| Courbe Coppock: | 7.97 |
| MA7: | 14,496.00 | |
| MA20: | 14,190.80 | |
| MA50: | 14,158.58 | |
| MA100: | 14,452.12 | |
| MAexp7: | 14,474.25 | |
| MAexp20: | 14,277.65 | |
| MAexp50: | 14,234.93 | |
| MAexp100: | 14,466.69 | |
| Price / MA7: | +0.37% | |
| Price / MA20: | +2.52% | |
| Price / MA50: | +2.76% | |
| Price / MA100: | +0.67% | |
| Price / MAexp7: | +0.52% | |
| Price / MAexp20: | +1.90% | |
| Price / MAexp50: | +2.21% | |
| Price / MAexp100: | +0.57% |
About author

Online


Add a comment
Comments
0 comments on the analysis DAX40 FULL0625 - Daily