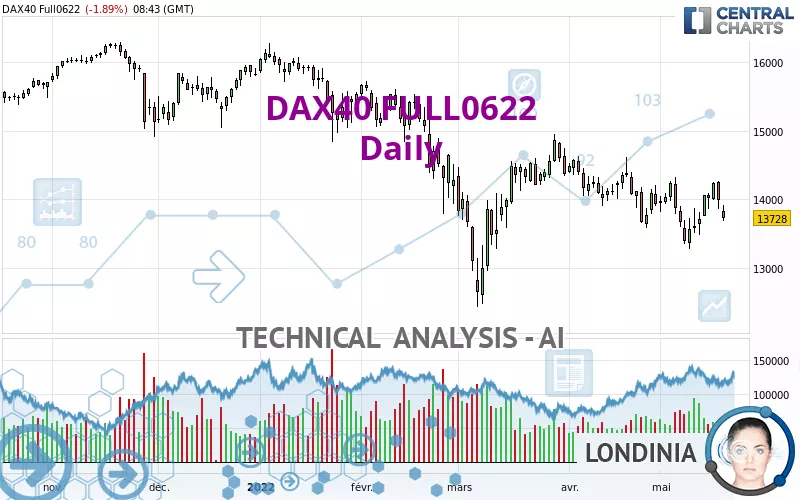
DAX40 FULL0925 - Daily - Technical analysis published on 05/19/2022 (GMT)
- 215
- 0
Click here for a new analysis!
- Timeframe : Daily
- - Analysis generated on
- Status : INVALID

Summary of the analysis

Additional analysis
Quotes
The DAX40 FULL0622 rating is 13,728.00 EUR. The price is lower by -1.89% since the last closing with the lowest point at 13,687.00 EUR and the highest point at 13,921.00 EUR. The deviation from the price is +0.30% for the low point and -1.39% for the high point.A bearish gap was detected at the opening by the Central Gaps scanner. There are a lot of sellers and they have the upper hand in the very short term.
Opening Gap DOWN
Type : Bearish
Timeframe : Openning
A study of price movements over other periods shows the following variations:
Near a new HIGH record (1 month)
Type : Bullish
Timeframe : Weekly
Technical
Technical analysis of DAX40 FULL0622 in Daily shows a overall strongly bearish trend. 85.71% of the signals given by moving averages are bearish. The overall trend is supported by the strong bearish signals from short-term moving averages. The Central Indicators scanner detects a bearish signal on moving averages that could impact this trend:
Bearish price crossover with Moving Average 20
Type : Bearish
Timeframe : Daily
An assessment of technical indicators does not currently provide any relevant information on the direction of future price movements.
Central Indicators, the detector scanner for these technical indicators has recently detected several signals:
Pivot points : price is under support 1
Type : Neutral
Timeframe : Daily
RSI indicator is back under 50
Type : Bearish
Timeframe : Daily
Price is back under the pivot point
Type : Bearish
Timeframe : Weekly
Momentum indicator is back under 0
Type : Bearish
Timeframe : Daily
Williams %R indicator is back under -50
Type : Bearish
Timeframe : Daily
Central Patterns, the scanner specializing in chart patterns, did not identify any signals.
The Central Candlesticks scanner, specialised in Japanese candlesticks, did not identify any signals.
| S3 | S2 | S1 | Price | R1 | R2 | R3 | |
|---|---|---|---|---|---|---|---|
| ProTrendLines | 12,668.00 | 13,391.00 | 13,690.00 | 13,728.00 | 14,236.00 | 15,028.00 | 15,917.30 |
| Change (%) | -7.72% | -2.45% | -0.28% | - | +3.70% | +9.47% | +15.95% |
| Change | -1,060.00 | -337.00 | -38.00 | - | +508.00 | +1,300.00 | +2,189.30 |
| Level | Major | Minor | Major | - | Intermediate | Major | Minor |
Pivot points can also be used to set your price objectives. Here is the price situation in relation to pivot points:
| Pivot points | S3 | S2 | S1 | PP | R1 | R2 | R3 |
|---|---|---|---|---|---|---|---|
| Standard | 13,409.67 | 13,632.33 | 13,812.67 | 14,035.33 | 14,215.67 | 14,438.33 | 14,618.67 |
| Camarilla | 13,882.18 | 13,919.12 | 13,956.06 | 13,993.00 | 14,029.94 | 14,066.88 | 14,103.83 |
| Woodie | 13,388.50 | 13,621.75 | 13,791.50 | 14,024.75 | 14,194.50 | 14,427.75 | 14,597.50 |
| Fibonacci | 13,632.33 | 13,786.28 | 13,881.39 | 14,035.33 | 14,189.28 | 14,284.39 | 14,438.33 |
| Pivot points | S3 | S2 | S1 | PP | R1 | R2 | R3 |
|---|---|---|---|---|---|---|---|
| Standard | 12,716.00 | 12,994.00 | 13,504.00 | 13,782.00 | 14,292.00 | 14,570.00 | 15,080.00 |
| Camarilla | 13,797.30 | 13,869.53 | 13,941.77 | 14,014.00 | 14,086.23 | 14,158.47 | 14,230.70 |
| Woodie | 12,832.00 | 13,052.00 | 13,620.00 | 13,840.00 | 14,408.00 | 14,628.00 | 15,196.00 |
| Fibonacci | 12,994.00 | 13,295.02 | 13,480.98 | 13,782.00 | 14,083.02 | 14,268.98 | 14,570.00 |
| Pivot points | S3 | S2 | S1 | PP | R1 | R2 | R3 |
|---|---|---|---|---|---|---|---|
| Standard | 12,412.33 | 12,994.67 | 13,458.33 | 14,040.67 | 14,504.33 | 15,086.67 | 15,550.33 |
| Camarilla | 13,634.35 | 13,730.23 | 13,826.12 | 13,922.00 | 14,017.88 | 14,113.77 | 14,209.65 |
| Woodie | 12,353.00 | 12,965.00 | 13,399.00 | 14,011.00 | 14,445.00 | 15,057.00 | 15,491.00 |
| Fibonacci | 12,994.67 | 13,394.24 | 13,641.10 | 14,040.67 | 14,440.24 | 14,687.10 | 15,086.67 |
Numerical data
The following is the status of technical indicators and moving averages registered at the time this technical analysis was created:
| RSI (14): | 45.04 | |
| MACD (12,26,9): | -76.0200 | |
| Directional Movement: | -4.76 | |
| AROON (14): | -21.43 | |
| DEMA (21): | 13,806.97 | |
| Parabolic SAR (0,02-0,02-0,2): | 13,382.64 | |
| Elder Ray (13): | -82.42 | |
| Super Trend (3,10): | 14,485.78 | |
| Zig ZAG (10): | 13,733.00 | |
| VORTEX (21): | 0.9100 | |
| Stochastique (14,3,5): | 66.22 | |
| TEMA (21): | 13,833.23 | |
| Williams %R (14): | -55.81 | |
| Chande Momentum Oscillator (20): | -290.00 | |
| Repulse (5,40,3): | -1.5300 | |
| ROCnROLL: | 2 | |
| TRIX (15,9): | -0.1100 | |
| Courbe Coppock: | 1.95 |
| MA7: | 13,885.86 | |
| MA20: | 13,878.05 | |
| MA50: | 14,107.16 | |
| MA100: | 14,664.41 | |
| MAexp7: | 13,882.13 | |
| MAexp20: | 13,921.63 | |
| MAexp50: | 14,137.54 | |
| MAexp100: | 14,495.55 | |
| Price / MA7: | -1.14% | |
| Price / MA20: | -1.08% | |
| Price / MA50: | -2.69% | |
| Price / MA100: | -6.39% | |
| Price / MAexp7: | -1.11% | |
| Price / MAexp20: | -1.39% | |
| Price / MAexp50: | -2.90% | |
| Price / MAexp100: | -5.30% |
About author

Online


Add a comment
Comments
0 comments on the analysis DAX40 FULL0925 - Daily