DAX40 FULL0925 - Daily - Technical analysis published on 07/20/2021 (GMT)
- 247
- 0
Click here for a new analysis!
- Timeframe : Daily
- - Analysis generated on
- Status : INVALID

Summary of the analysis

Additional analysis
Quotes
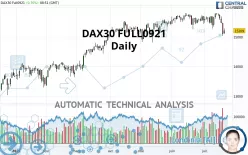
DAX30 FULL0921 rating 15,209.00 EUR. The price has increased by +0.76% since the last closing with the lowest point at 15,098.00 EUR and the highest point at 15,287.00 EUR. The deviation from the price is +0.74% for the low point and -0.51% for the high point.The Central Gaps scanner detects a bullish opening marking the presence of buyers ahead of sellers at the opening but not sufficiently marked to allow the price to register a quotation gap.
Bullish opening
Type : Bullish
Timeframe : Openning
A study of price movements over other periods shows the following variations:
Near a new HIGH record (1st january)
Type : Bullish
Timeframe : Weekly
Technical
A technical analysis in Daily of this DAX30 FULL0921 chart shows a slightly bullish trend. 53.57% of the signals given by moving averages are bullish. Caution: the strong bearish signals currently being given by short-term moving averages indicate that this slightly bullish trend could be reversed. An assessment of moving averages reveals several bearish signals that could impact this trend:
Bearish price crossover with Moving Average 100
Type : Bearish
Timeframe : Daily
Bearish price crossover with adaptative moving average 50
Type : Bearish
Timeframe : Daily
Bearish price crossover with adaptative moving average 100
Type : Bearish
Timeframe : Daily
In fact, 12 technical indicators on 18 studied are currently positioned bearish. Caution: the Central Indicators scanner currently detects an excess:
CCI indicator is oversold : under -100
Type : Neutral
Timeframe : Daily
Williams %R indicator is oversold : under -80
Type : Neutral
Timeframe : Daily
Pivot points : price is under support 3
Type : Neutral
Timeframe : Weekly
Parabolic SAR indicator bearish reversal
Type : Bearish
Timeframe : Daily
Ichimoku : price is under the cloud
Type : Bearish
Timeframe : Daily
SuperTrend indicator bearish reversal
Type : Bearish
Timeframe : Daily
MACD indicator is back under 0
Type : Bearish
Timeframe : Daily
Price is back under the pivot point
Type : Bearish
Timeframe : Daily
Central Patterns, the scanner specializing in chart patterns, did not identify any signals.
No result was found by the Central Candlesticks scanner on Japanese candlesticks.
| S3 | S2 | S1 | Price | R1 | R2 | |
|---|---|---|---|---|---|---|
| ProTrendLines | 13,395.50 | 13,778.50 | 14,916.00 | 15,209.00 | 15,414.30 | 15,738.00 |
| Change (%) | -11.92% | -9.41% | -1.93% | - | +1.35% | +3.48% |
| Change | -1,813.50 | -1,430.50 | -293.00 | - | +205.30 | +529.00 |
| Level | Intermediate | Major | Minor | - | Major | Intermediate |
Pivot points can also be used to set your price objectives. Here is the price situation in relation to pivot points:
| Pivot points | S3 | S2 | S1 | PP | R1 | R2 | R3 |
|---|---|---|---|---|---|---|---|
| Standard | 14,480.00 | 14,756.00 | 14,925.00 | 15,201.00 | 15,370.00 | 15,646.00 | 15,815.00 |
| Camarilla | 14,971.63 | 15,012.42 | 15,053.21 | 15,094.00 | 15,134.79 | 15,175.58 | 15,216.38 |
| Woodie | 14,426.50 | 14,729.25 | 14,871.50 | 15,174.25 | 15,316.50 | 15,619.25 | 15,761.50 |
| Fibonacci | 14,756.00 | 14,925.99 | 15,031.01 | 15,201.00 | 15,370.99 | 15,476.01 | 15,646.00 |
| Pivot points | S3 | S2 | S1 | PP | R1 | R2 | R3 |
|---|---|---|---|---|---|---|---|
| Standard | 15,013.67 | 15,237.33 | 15,354.67 | 15,578.33 | 15,695.67 | 15,919.33 | 16,036.67 |
| Camarilla | 15,378.23 | 15,409.48 | 15,440.74 | 15,472.00 | 15,503.26 | 15,534.52 | 15,565.78 |
| Woodie | 14,960.50 | 15,210.75 | 15,301.50 | 15,551.75 | 15,642.50 | 15,892.75 | 15,983.50 |
| Fibonacci | 15,237.33 | 15,367.60 | 15,448.07 | 15,578.33 | 15,708.60 | 15,789.07 | 15,919.33 |
| Pivot points | S3 | S2 | S1 | PP | R1 | R2 | R3 |
|---|---|---|---|---|---|---|---|
| Standard | 14,741.67 | 14,999.33 | 15,280.67 | 15,538.33 | 15,819.67 | 16,077.33 | 16,358.67 |
| Camarilla | 15,413.78 | 15,463.18 | 15,512.59 | 15,562.00 | 15,611.41 | 15,660.82 | 15,710.23 |
| Woodie | 14,753.50 | 15,005.25 | 15,292.50 | 15,544.25 | 15,831.50 | 16,083.25 | 16,370.50 |
| Fibonacci | 14,999.33 | 15,205.23 | 15,332.44 | 15,538.33 | 15,744.23 | 15,871.44 | 16,077.33 |
Numerical data
The following is the status of the technical indicators and moving averages at the time of publication of this technical analysis:
| RSI (14): | 40.65 | |
| MACD (12,26,9): | -42.6200 | |
| Directional Movement: | -25.98 | |
| AROON (14): | -28.57 | |
| DEMA (21): | 15,502.19 | |
| Parabolic SAR (0,02-0,02-0,2): | 15,786.60 | |
| Elder Ray (13): | -308.63 | |
| Super Trend (3,10): | 15,845.02 | |
| Zig ZAG (10): | 15,210.00 | |
| VORTEX (21): | 0.9600 | |
| Stochastique (14,3,5): | 22.15 | |
| TEMA (21): | 15,421.66 | |
| Williams %R (14): | -70.52 | |
| Chande Momentum Oscillator (20): | -390.00 | |
| Repulse (5,40,3): | -1.6700 | |
| ROCnROLL: | 2 | |
| TRIX (15,9): | 0.0100 | |
| Courbe Coppock: | 1.45 |
| MA7: | 15,535.71 | |
| MA20: | 15,566.20 | |
| MA50: | 15,534.20 | |
| MA100: | 15,220.45 | |
| MAexp7: | 15,429.58 | |
| MAexp20: | 15,534.03 | |
| MAexp50: | 15,465.68 | |
| MAexp100: | 15,147.01 | |
| Price / MA7: | -2.10% | |
| Price / MA20: | -2.29% | |
| Price / MA50: | -2.09% | |
| Price / MA100: | -0.08% | |
| Price / MAexp7: | -1.43% | |
| Price / MAexp20: | -2.09% | |
| Price / MAexp50: | -1.66% | |
| Price / MAexp100: | +0.41% |
About author

Online


Add a comment
Comments
0 comments on the analysis DAX40 FULL0925 - Daily