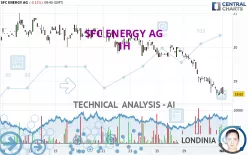
SFC ENERGY AG - 1H - Technical analysis published on 11/01/2024 (GMT)
- 129
- 0
Click here for a new analysis!
- Timeframe : 1H
- - Analysis generated on
- Status : LEVEL MAINTAINED

Summary of the analysis

Additional analysis
Quotes
The SFC ENERGY AG rating is 18.62 EUR. On the day, this instrument lost -0.11% and was between 18.62 EUR and 18.82 EUR. This implies that the price is at 0% from its lowest and at -1.06% from its highest.The Central Gaps scanner detects a bullish opening marking the presence of buyers ahead of sellers at the opening but not sufficiently marked to allow the price to register a quotation gap.
Bullish opening
Type : Bullish
Timeframe : Openning
So that you have an overall view of the price change, here is a table showing the variations over several periods:
Near a new LOW record (1 month)
Type : Bearish
Timeframe : Weekly
Technical
A technical analysis in 1H of this SFC ENERGY AG chart shows a sharp bearish trend. The signals given by moving averages are 92.86% bearish. This strong bearish trend is confirmed by the strong signals currently being given by short-term moving averages. The Central Indicators scanner does not detect any result on moving averages that would impact this trend.
The technical indicators are generally neutral. They do not provide relevant information on the direction of future price movements.
Caution: the Central Indicators scanner currently detects an excess:
RSI indicator is oversold : under 30
Type : Neutral
Timeframe : 1 hour
CCI indicator is oversold : under -100
Type : Neutral
Timeframe : 1 hour
Williams %R indicator is oversold : under -80
Type : Neutral
Timeframe : 1 hour
Pivot points : price is under support 3
Type : Neutral
Timeframe : Weekly
An analysis of the price chart with the Central Patterns scanner (detector of chart patterns and resistances and supports) shows a result that can have an impact on the price change:
Near horizontal resistance
Type : Bearish
Timeframe : 1 hour
Central Candlesticks, the scanner specialised in Japanese candlesticks, detects this inversion signal that could impact the current short-term trend:
Doji
Type : Neutral
Timeframe : 1 hour
| S3 | S2 | S1 | Price | R1 | R2 | R3 | |
|---|---|---|---|---|---|---|---|
| ProTrendLines | 16.03 | 17.54 | 18.39 | 18.62 | 18.64 | 19.12 | 19.56 |
| Change (%) | -13.91% | -5.80% | -1.24% | - | +0.11% | +2.69% | +5.05% |
| Change | -2.59 | -1.08 | -0.23 | - | +0.02 | +0.50 | +0.94 |
| Level | Major | Minor | Intermediate | - | Minor | Minor | Major |
To determine price objectives, it is also possible to use the pivot points. Here is the price position in relation to pivot points:
| Pivot points | S3 | S2 | S1 | PP | R1 | R2 | R3 |
|---|---|---|---|---|---|---|---|
| Standard | 17.98 | 18.28 | 18.46 | 18.76 | 18.94 | 19.24 | 19.42 |
| Camarilla | 18.51 | 18.55 | 18.60 | 18.64 | 18.68 | 18.73 | 18.77 |
| Woodie | 17.92 | 18.25 | 18.40 | 18.73 | 18.88 | 19.21 | 19.36 |
| Fibonacci | 18.28 | 18.46 | 18.58 | 18.76 | 18.94 | 19.06 | 19.24 |
| Pivot points | S3 | S2 | S1 | PP | R1 | R2 | R3 |
|---|---|---|---|---|---|---|---|
| Standard | 18.51 | 19.11 | 19.41 | 20.01 | 20.31 | 20.91 | 21.21 |
| Camarilla | 19.47 | 19.56 | 19.64 | 19.72 | 19.80 | 19.89 | 19.97 |
| Woodie | 18.37 | 19.04 | 19.27 | 19.94 | 20.17 | 20.84 | 21.07 |
| Fibonacci | 19.11 | 19.45 | 19.66 | 20.01 | 20.35 | 20.56 | 20.91 |
| Pivot points | S3 | S2 | S1 | PP | R1 | R2 | R3 |
|---|---|---|---|---|---|---|---|
| Standard | 15.39 | 16.99 | 17.81 | 19.41 | 20.23 | 21.83 | 22.65 |
| Camarilla | 17.98 | 18.20 | 18.42 | 18.64 | 18.86 | 19.08 | 19.31 |
| Woodie | 15.01 | 16.80 | 17.43 | 19.22 | 19.85 | 21.64 | 22.27 |
| Fibonacci | 16.99 | 17.91 | 18.48 | 19.41 | 20.33 | 20.90 | 21.83 |
Numerical data
The following are the details of the technical indicators and moving averages that were collected to generate this technical analysis:
| RSI (14): | 25.91 | |
| MACD (12,26,9): | -0.2600 | |
| Directional Movement: | -25.60 | |
| AROON (14): | -64.29 | |
| DEMA (21): | 18.58 | |
| Parabolic SAR (0,02-0,02-0,2): | 18.59 | |
| Elder Ray (13): | -0.17 | |
| Super Trend (3,10): | 19.03 | |
| Zig ZAG (10): | 18.62 | |
| VORTEX (21): | 0.7100 | |
| Stochastique (14,3,5): | 8.51 | |
| TEMA (21): | 18.51 | |
| Williams %R (14): | -92.59 | |
| Chande Momentum Oscillator (20): | -0.40 | |
| Repulse (5,40,3): | -1.5600 | |
| ROCnROLL: | 2 | |
| TRIX (15,9): | -0.1900 | |
| Courbe Coppock: | 4.96 |
| MA7: | 19.27 | |
| MA20: | 19.95 | |
| MA50: | 20.23 | |
| MA100: | 20.40 | |
| MAexp7: | 18.68 | |
| MAexp20: | 18.92 | |
| MAexp50: | 19.33 | |
| MAexp100: | 19.68 | |
| Price / MA7: | -3.37% | |
| Price / MA20: | -6.67% | |
| Price / MA50: | -7.96% | |
| Price / MA100: | -8.73% | |
| Price / MAexp7: | -0.32% | |
| Price / MAexp20: | -1.59% | |
| Price / MAexp50: | -3.67% | |
| Price / MAexp100: | -5.39% |
News
The latest news and videos published on SFC ENERGY AG at the time of the analysis were as follows:
- EQS-News: SFC Energy AG and HÖRMANN Warnsysteme present an innovative pilot project for securing the emergency power supply of siren warning systems using fuel cells
- EQS-News: SFC Energy joins the ranks of the world's largest renewable energy companies with its inclusion in the RENIXX World equity index – alongside industry giants such as Tesla, Orsted and Vestas
- EQS-News: SFC Energy to acquire Small Stationary Business Assets, Technology, IP and Customer Base from Ballard Power Systems Europe A/S
- EQS-News: SFC Energy AG celebrates the next milestone in its international expansion with the official opening of its largest production facility to date in Cluj, Romania
- EQS-News: SFC Energy delivers strong half-year financials – further improved net cash position of around EUR 66 million – international expansion and capacity build up according to plan
About author
Online


Add a comment
Comments
0 comments on the analysis SFC ENERGY AG - 1H