| Open: | - |
| Change: | - |
| Volume: | - |
| Low: | - |
| High: | - |
| High / Low range: | - |
| Type: | Stocks |
| Ticker: | F3C |
| ISIN: | DE0007568578 |
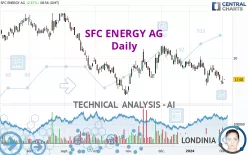
SFC ENERGY AG - Daily - Technical analysis published on 02/02/2024 (GMT)
- 130
- 0
- 02/02/2024 - 09:25
Click here for a new analysis!
- Timeframe : Daily
- - Analysis generated on 02/02/2024 - 09:25
- Status : LEVEL MAINTAINED

Summary of the analysis

Additional analysis
Quotes
The SFC ENERGY AG price is 17.68 EUR. The price registered an increase of +2.67% on the session and was between 17.64 EUR and 17.68 EUR. This implies that the price is at +0.23% from its lowest and at 0% from its highest.A bullish opening was detected by the Central Gaps scanner. Buyers are trying to impose a bullish momentum in the very short term.
Bullish opening
Type : Bullish
Timeframe : Openning
So that you have an overall view of the price change, here is a table showing the variations over several periods:
Near a new LOW record (1st january)
Type : Bearish
Timeframe : Weekly
Near a new LOW record (1 month)
Type : Bearish
Timeframe : Weekly
Technical
A technical analysis in Daily of this SFC ENERGY AG chart shows a sharp bearish trend. 89.29% of the signals given by moving averages are bearish. This strongly bearish trend is supported by the strong bearish signals given by short-term moving averages. There is no crossing of moving average by the price or crossing of moving averages between themselves.
In fact, of the 18 technical indicators analysed by Central Analyzer, 4 are bullish, 5 are neutral and 9 are bearish. Caution: the Central Indicators scanner currently detects an excess:
CCI indicator is oversold : under -100
Type : Neutral
Timeframe : Daily
RSI indicator: bullish divergence
Type : Bullish
Timeframe : Daily
Pivot points : price is under support 1
Type : Neutral
Timeframe : Weekly
Momentum indicator is back over 0
Type : Bullish
Timeframe : Daily
Central Patterns, the market scanner focusing on chart patterns, resistances and supports found this result:
Horizontal resistance is broken
Type : Bullish
Timeframe : Daily
The Central Candlesticks scanner which studies Japanese candlesticks did not detect anything.
| S3 | S2 | S1 | Price | R1 | R2 | R3 | |
|---|---|---|---|---|---|---|---|
| ProTrendLines | 12.16 | 15.96 | 17.44 | 17.68 | 18.77 | 20.05 | 21.90 |
| Change (%) | -31.22% | -9.73% | -1.36% | - | +6.17% | +13.40% | +23.87% |
| Change | -5.52 | -1.72 | -0.24 | - | +1.09 | +2.37 | +4.22 |
| Level | Intermediate | Major | Minor | - | Intermediate | Major | Intermediate |
Pivot points can also be used to set your price objectives. Here is the price situation in relation to pivot points:
| Pivot points | S3 | S2 | S1 | PP | R1 | R2 | R3 |
|---|---|---|---|---|---|---|---|
| Standard | 16.10 | 16.66 | 16.94 | 17.50 | 17.78 | 18.34 | 18.62 |
| Camarilla | 16.99 | 17.07 | 17.14 | 17.22 | 17.30 | 17.37 | 17.45 |
| Woodie | 15.96 | 16.59 | 16.80 | 17.43 | 17.64 | 18.27 | 18.48 |
| Fibonacci | 16.66 | 16.98 | 17.18 | 17.50 | 17.82 | 18.02 | 18.34 |
| Pivot points | S3 | S2 | S1 | PP | R1 | R2 | R3 |
|---|---|---|---|---|---|---|---|
| Standard | 16.48 | 17.16 | 17.86 | 18.54 | 19.24 | 19.92 | 20.62 |
| Camarilla | 18.18 | 18.31 | 18.43 | 18.56 | 18.69 | 18.81 | 18.94 |
| Woodie | 16.49 | 17.17 | 17.87 | 18.55 | 19.25 | 19.93 | 20.63 |
| Fibonacci | 17.16 | 17.69 | 18.01 | 18.54 | 19.07 | 19.39 | 19.92 |
| Pivot points | S3 | S2 | S1 | PP | R1 | R2 | R3 |
|---|---|---|---|---|---|---|---|
| Standard | 13.17 | 15.11 | 16.28 | 18.22 | 19.39 | 21.33 | 22.50 |
| Camarilla | 16.61 | 16.89 | 17.18 | 17.46 | 17.75 | 18.03 | 18.32 |
| Woodie | 12.80 | 14.92 | 15.91 | 18.03 | 19.02 | 21.14 | 22.13 |
| Fibonacci | 15.11 | 16.30 | 17.03 | 18.22 | 19.41 | 20.14 | 21.33 |
Numerical data
The following are the details of the technical indicators and moving averages that were collected to generate this technical analysis:
| RSI (14): | 42.52 | |
| MACD (12,26,9): | -0.4300 | |
| Directional Movement: | -8.09 | |
| AROON (14): | -14.29 | |
| DEMA (21): | 17.77 | |
| Parabolic SAR (0,02-0,02-0,2): | 18.92 | |
| Elder Ray (13): | -0.41 | |
| Super Trend (3,10): | 19.54 | |
| Zig ZAG (10): | 17.68 | |
| VORTEX (21): | 0.8900 | |
| Stochastique (14,3,5): | 17.35 | |
| TEMA (21): | 17.53 | |
| Williams %R (14): | -70.64 | |
| Chande Momentum Oscillator (20): | 0.24 | |
| Repulse (5,40,3): | -3.7100 | |
| ROCnROLL: | 2 | |
| TRIX (15,9): | -0.2700 | |
| Courbe Coppock: | 10.39 |
| MA7: | 17.83 | |
| MA20: | 18.40 | |
| MA50: | 19.17 | |
| MA100: | 19.03 | |
| MAexp7: | 17.79 | |
| MAexp20: | 18.31 | |
| MAexp50: | 18.84 | |
| MAexp100: | 19.46 | |
| Price / MA7: | -0.84% | |
| Price / MA20: | -3.91% | |
| Price / MA50: | -7.77% | |
| Price / MA100: | -7.09% | |
| Price / MAexp7: | -0.62% | |
| Price / MAexp20: | -3.44% | |
| Price / MAexp50: | -6.16% | |
| Price / MAexp100: | -9.15% |
News
The latest news and videos published on SFC ENERGY AG at the time of the analysis were as follows:
- 01/17/2024 - 06:30 EQS-News: SFC Energy starts the new year successfully – repeat order for fuel cells received from Oneberry Technologies in Singapore totalling EUR 2.1 million
- 12/08/2023 - 06:30 EQS-News: Supervisory Board of SFC Energy AG extends Management Board contract of CEO Dr. Peter Podesser by another 5 years
- 12/07/2023 - 06:30 EQS-News: SFC Energy AG receives another follow-up order from LiveView Technologies USA and further expands global presence with new US location
- 11/27/2023 - 06:30 EQS-News: SFC Energy AG announces mid-term targets for 2028 - growth to EUR 400 to 500 million Group sales planned
- 11/15/2023 - 06:30 EQS-News: SFC Energy AG posts continued strong growth and higher margins – sales forecast for 2023 raised
About author
Online


Add a comment
Comments
0 comments on the analysis SFC ENERGY AG - Daily