HELIAD AG NA O.N. - Daily - Technical analysis published on 09/20/2023 (GMT)
- 180
- 0
Click here for a new analysis!
- Timeframe : Daily
- - Analysis generated on
- Status : TARGET REACHED
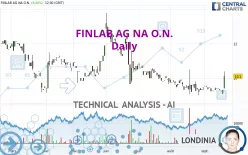

Summary of the analysis

Additional analysis
Quotes
The FINLAB AG NA O.N. price is 10.10 EUR. On the day, this instrument gained +8.60% and was traded between 9.40 EUR and 10.40 EUR over the period. The price is currently at +7.45% from its lowest and -2.88% from its highest.The Central Gaps scanner detects the formation of a bullish gap marking the strong presence of buyers against sellers at the opening. This formed a quotation gap.
Opening Gap UP
Type : Bullish
Timeframe : Openning
A study of price movements over other periods shows the following variations:
Near a new LOW record (5 years)
Type : Bearish
Timeframe : Weekly
Near a new LOW record (1 year)
Type : Bearish
Timeframe : Weekly
Near a new LOW record (1st january)
Type : Bearish
Timeframe : Weekly
Near a new LOW record (1 month)
Type : Bearish
Timeframe : Weekly
Technical
Technical analysis of this Daily chart of FINLAB AG NA O.N. indicates that the overall trend is not clearly defined. This indecision could turn into a bullish trend due to the strong bullish signals currently being given by short-term moving averages. An assessment of moving averages reveals several bullish signals that could impact this trend:
Bullish price crossover with Moving Average 20
Type : Bullish
Timeframe : Daily
Bullish price crossover with Moving Average 50
Type : Bullish
Timeframe : Daily
Bullish price crossover with adaptative moving average 20
Type : Bullish
Timeframe : Daily
Bullish price crossover with adaptative moving average 50
Type : Bullish
Timeframe : Daily
In fact, 10 technical indicators on 18 studied are currently bullish. But beware of excesses. The Central Indicators scanner currently detects this:
CCI indicator is overbought : over 100
Type : Neutral
Timeframe : Daily
CCI indicator: bullish divergence
Type : Bullish
Timeframe : Daily
Williams %R indicator is overbought : over -20
Type : Neutral
Timeframe : Daily
Pivot points : price is over resistance 3
Type : Neutral
Timeframe : Daily
Pivot points : price is over resistance 3
Type : Neutral
Timeframe : Weekly
RSI indicator is back over 50
Type : Bullish
Timeframe : Daily
Parabolic SAR indicator bullish reversal
Type : Bullish
Timeframe : Daily
Aroon indicator bullish trend
Type : Bullish
Timeframe : Daily
SuperTrend indicator bullish reversal
Type : Bullish
Timeframe : Daily
Momentum indicator is back over 0
Type : Bullish
Timeframe : Daily
The Central Patterns scanner, which studies chart patterns, resistances and supports, has identified this signal:
Resistance of channel is broken
Type : Bullish
Timeframe : Daily
For a small rebound in the very short term, the Central Candlesticks scanner currently notes the presence of these bullish patterns in Japanese candlesticks:
White line without lower shadow
Type : Bullish
Timeframe : Daily
Upside gap
Type : Bullish
Timeframe : Daily
Long white line
Type : Bullish
Timeframe : Daily
| S2 | S1 | Price | R1 | R2 | R3 | |
|---|---|---|---|---|---|---|
| ProTrendLines | 3.58 | 9.22 | 10.10 | 10.50 | 11.30 | 12.88 |
| Change (%) | -64.55% | -8.71% | - | +3.96% | +11.88% | +27.52% |
| Change | -6.52 | -0.88 | - | +0.40 | +1.20 | +2.78 |
| Level | Minor | Major | - | Minor | Minor | Intermediate |
Pivot points can also be used to set your price objectives. Here is the price situation in relation to pivot points:
| Pivot points | S3 | S2 | S1 | PP | R1 | R2 | R3 |
|---|---|---|---|---|---|---|---|
| Standard | 8.88 | 8.97 | 9.13 | 9.22 | 9.38 | 9.47 | 9.63 |
| Camarilla | 9.23 | 9.25 | 9.28 | 9.30 | 9.32 | 9.35 | 9.37 |
| Woodie | 8.93 | 8.99 | 9.18 | 9.24 | 9.43 | 9.49 | 9.68 |
| Fibonacci | 8.97 | 9.06 | 9.12 | 9.22 | 9.31 | 9.37 | 9.47 |
| Pivot points | S3 | S2 | S1 | PP | R1 | R2 | R3 |
|---|---|---|---|---|---|---|---|
| Standard | 9.05 | 9.15 | 9.25 | 9.35 | 9.45 | 9.55 | 9.65 |
| Camarilla | 9.30 | 9.31 | 9.33 | 9.35 | 9.37 | 9.39 | 9.41 |
| Woodie | 9.05 | 9.15 | 9.25 | 9.35 | 9.45 | 9.55 | 9.65 |
| Fibonacci | 9.15 | 9.23 | 9.27 | 9.35 | 9.43 | 9.47 | 9.55 |
| Pivot points | S3 | S2 | S1 | PP | R1 | R2 | R3 |
|---|---|---|---|---|---|---|---|
| Standard | 7.30 | 8.15 | 8.80 | 9.65 | 10.30 | 11.15 | 11.80 |
| Camarilla | 9.04 | 9.18 | 9.31 | 9.45 | 9.59 | 9.73 | 9.86 |
| Woodie | 7.20 | 8.10 | 8.70 | 9.60 | 10.20 | 11.10 | 11.70 |
| Fibonacci | 8.15 | 8.72 | 9.08 | 9.65 | 10.22 | 10.58 | 11.15 |
Numerical data
The following are the details of the technical indicators and moving averages that were collected to generate this technical analysis:
| RSI (14): | 66.38 | |
| MACD (12,26,9): | -0.0400 | |
| Directional Movement: | 23.66 | |
| AROON (14): | 7.14 | |
| DEMA (21): | 9.38 | |
| Parabolic SAR (0,02-0,02-0,2): | 9.00 | |
| Elder Ray (13): | 0.43 | |
| Super Trend (3,10): | 9.18 | |
| Zig ZAG (10): | 10.10 | |
| VORTEX (21): | 0.8800 | |
| Stochastique (14,3,5): | 47.35 | |
| TEMA (21): | 9.51 | |
| Williams %R (14): | -22.22 | |
| Chande Momentum Oscillator (20): | 0.60 | |
| Repulse (5,40,3): | 9.6900 | |
| ROCnROLL: | 1 | |
| TRIX (15,9): | -0.1600 | |
| Courbe Coppock: | 0.79 |
| MA7: | 9.46 | |
| MA20: | 9.40 | |
| MA50: | 9.67 | |
| MA100: | 10.32 | |
| MAexp7: | 9.52 | |
| MAexp20: | 9.47 | |
| MAexp50: | 9.73 | |
| MAexp100: | 10.14 | |
| Price / MA7: | +6.77% | |
| Price / MA20: | +7.45% | |
| Price / MA50: | +4.45% | |
| Price / MA100: | -2.13% | |
| Price / MAexp7: | +6.09% | |
| Price / MAexp20: | +6.65% | |
| Price / MAexp50: | +3.80% | |
| Price / MAexp100: | -0.39% |
News
The latest news and videos published on FINLAB AG NA O.N. at the time of the analysis were as follows:
- EQS-Adhoc: FinLab AG: Merger of Heliad Equity Partners GmbH & Co. KGaA into FinLab AG: Mutual Understanding on exchange ratio
- EQS-Adhoc: FinLab AG: Plans of Merger with Heliad Equity Partners GmbH & Co. KGaA
- EQS-Adhoc: FinLab AG: nextmarkets AG, an investment of FinLab AG, decides to liquidate its subsidiaries and other assets and will subsequently propose the liquidation to the Annual General Meeting.
- FinLab AG: FinLab's portfolio company Raisin secures €60M in Series E funding round, reinforcing its position as a pioneer in the German fintech ecosystem.
- EQS-Adhoc: FinLab AG: FinLab publishes preliminary 2022 results and NAV as of December 31, 2022
About author
Online


Add a comment
Comments
0 comments on the analysis HELIAD AG NA O.N. - Daily