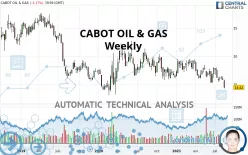
CABOT OIL & GAS - Weekly - Technical analysis published on 08/23/2021 (GMT)
- 440
- 0
Click here for a new analysis!
- Timeframe : Weekly
- - Analysis generated on
- Status : INVALID

Summary of the analysis
Additional analysis
Quotes
CABOT OIL & GAS rating 14.42 USD. The price is lower by -6.79% over the 5 days and has been traded over the last 5 days between 14.28 USD and 14.90 USD. This implies that the 5 day price is +0.98% from its lowest point and -3.22% from its highest point.A study of price movements over other periods shows the following variations:
Near a new LOW record (1 year)
Type : Bearish
Timeframe : Weekly
Near a new LOW record (1st january)
Type : Bearish
Timeframe : Weekly
Near a new LOW record (1 month)
Type : Bearish
Timeframe : Weekly
Technical
Technical analysis of this Weekly chart of CABOT OIL & GAS indicates that the overall trend is strongly bearish. The signals given by moving averages are 89.29% bearish. This strong bearish trend is confirmed by the strong signals currently being given by short-term moving averages. The Central Indicators market scanner currently does not detect any result that concerns moving averages.
The probability of a further decline is moderate given the direction of the technical indicators.
Caution: the Central Indicators scanner currently detects an excess:
Williams %R indicator is oversold : under -80
Type : Neutral
Timeframe : Weekly
Pivot points : price is under support 3
Type : Neutral
Timeframe : Weekly
The Central Patterns scanner, which studies chart patterns, resistances and supports, has identified this signal:
Support of channel is broken
Type : Bearish
Timeframe : Weekly
The Central Candlesticks scanner, specialised in Japanese candlesticks, did not identify any signals.
| S3 | S2 | S1 | Price | R1 | R2 | R3 | |
|---|---|---|---|---|---|---|---|
| ProTrendLines | 4.62 | 11.56 | 13.51 | 14.42 | 14.97 | 19.30 | 22.27 |
| Change (%) | -67.96% | -19.83% | -6.31% | - | +3.81% | +33.84% | +54.44% |
| Change | -9.80 | -2.86 | -0.91 | - | +0.55 | +4.88 | +7.85 |
| Level | Minor | Minor | Intermediate | - | Major | Intermediate | Major |
Pivot points can also be used to set your price objectives. Here is the price situation in relation to pivot points:
| Pivot points | S3 | S2 | S1 | PP | R1 | R2 | R3 |
|---|---|---|---|---|---|---|---|
| Standard | 13.98 | 14.17 | 14.30 | 14.49 | 14.62 | 14.81 | 14.94 |
| Camarilla | 14.33 | 14.36 | 14.39 | 14.42 | 14.45 | 14.48 | 14.51 |
| Woodie | 13.94 | 14.16 | 14.26 | 14.48 | 14.58 | 14.80 | 14.90 |
| Fibonacci | 14.17 | 14.30 | 14.37 | 14.49 | 14.62 | 14.69 | 14.81 |
| Pivot points | S3 | S2 | S1 | PP | R1 | R2 | R3 |
|---|---|---|---|---|---|---|---|
| Standard | 14.88 | 15.27 | 15.55 | 15.94 | 16.22 | 16.61 | 16.89 |
| Camarilla | 15.64 | 15.70 | 15.76 | 15.82 | 15.88 | 15.94 | 16.00 |
| Woodie | 14.82 | 15.24 | 15.49 | 15.91 | 16.16 | 16.58 | 16.83 |
| Fibonacci | 15.27 | 15.53 | 15.69 | 15.94 | 16.20 | 16.36 | 16.61 |
| Pivot points | S3 | S2 | S1 | PP | R1 | R2 | R3 |
|---|---|---|---|---|---|---|---|
| Standard | 12.11 | 13.70 | 14.79 | 16.38 | 17.47 | 19.06 | 20.15 |
| Camarilla | 15.15 | 15.40 | 15.64 | 15.89 | 16.14 | 16.38 | 16.63 |
| Woodie | 11.87 | 13.58 | 14.55 | 16.26 | 17.23 | 18.94 | 19.91 |
| Fibonacci | 13.70 | 14.72 | 15.35 | 16.38 | 17.40 | 18.03 | 19.06 |
Numerical data
The following are the details of the technical indicators and moving averages that were collected to generate this technical analysis:
| RSI (14): | 38.31 | |
| MACD (12,26,9): | -0.5400 | |
| Directional Movement: | -13.87 | |
| AROON (14): | -92.86 | |
| DEMA (21): | 15.82 | |
| Parabolic SAR (0,02-0,02-0,2): | 17.75 | |
| Elder Ray (13): | -1.12 | |
| Super Trend (3,10): | 18.65 | |
| Zig ZAG (10): | 14.42 | |
| VORTEX (21): | 0.8700 | |
| Stochastique (14,3,5): | 17.35 | |
| TEMA (21): | 15.47 | |
| Williams %R (14): | -96.54 | |
| Chande Momentum Oscillator (20): | -1.87 | |
| Repulse (5,40,3): | -13.6800 | |
| ROCnROLL: | 2 | |
| TRIX (15,9): | -0.3000 | |
| Courbe Coppock: | 13.38 |
| MA7: | 15.27 | |
| MA20: | 15.74 | |
| MA50: | 16.21 | |
| MA100: | 16.62 | |
| MAexp7: | 15.73 | |
| MAexp20: | 16.45 | |
| MAexp50: | 17.07 | |
| MAexp100: | 17.85 | |
| Price / MA7: | -5.57% | |
| Price / MA20: | -8.39% | |
| Price / MA50: | -11.04% | |
| Price / MA100: | -13.24% | |
| Price / MAexp7: | -8.33% | |
| Price / MAexp20: | -12.34% | |
| Price / MAexp50: | -15.52% | |
| Price / MAexp100: | -19.22% |
News
The last news published on CABOT OIL & GAS at the time of the generation of this analysis was as follows:
- Cabot Oil & Gas Corporation Reports Second Quarter 2021 Results
- Cabot Oil & Gas Corporation Declares Dividend
- Cabot Oil & Gas Corporation Announces Second Quarter 2021 Earnings Release and Conference Call
- ALERT: Rowley Law PLLC is Investigating Proposed Merger of Cabot Oil & Gas Corporation and Cimarex Energy Co.
- Cabot Oil Merger Investigation: Halper Sadeh LLP Announces Investigation Into Whether the Merger of Cabot Oil & Gas Corporation Is Fair to Shareholders; Investors Are Encouraged to Contact the Firm – COG
About author

Online


Add a comment
Comments
0 comments on the analysis CABOT OIL & GAS - Weekly