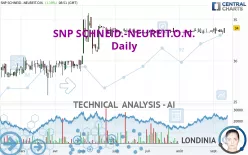
SNP SCHNEID.-NEUREIT.O.N. - Daily - Technical analysis published on 09/12/2023 (GMT)
- 143
- 0
Click here for a new analysis!
- Timeframe : Daily
- - Analysis generated on
- Status : TARGET REACHED

Summary of the analysis

Additional analysis
Quotes
The SNP SCHNEID.-NEUREIT.O.N. rating is 34.0 EUR. The price registered an increase of +1.19% on the session with the lowest point at 33.4 EUR and the highest point at 34.0 EUR. The deviation from the price is +1.80% for the low point and 0% for the high point.A bearish opening was detected by the Central Gaps scanner. Sellers are trying to impose a bearish trend in the very short term.
Bearish opening
Type : Bearish
Timeframe : Openning
So that you have an overall view of the price change, here is a table showing the variations over several periods:
Near a new HIGH record (1 month)
Type : Bullish
Timeframe : Weekly
Technical
Technical analysis of SNP SCHNEID.-NEUREIT.O.N. in Daily shows a strongly overall bullish trend. 92.86% of the signals given by moving averages are bullish. This strongly bullish trend is supported by the strong bullish signals given by short-term moving averages. An assessment of moving averages reveals a bullish signal that could impact this trend:
Bullish price crossover with Moving Average 20
Type : Bullish
Timeframe : Daily
An assessment of technical indicators shows a strong bullish signal.
Caution: the Central Indicators scanner currently detects an excess:
CCI indicator is overbought : over 100
Type : Neutral
Timeframe : Daily
Williams %R indicator is overbought : over -20
Type : Neutral
Timeframe : Daily
Pivot points : price is over resistance 2
Type : Neutral
Timeframe : Daily
RSI indicator is back over 50
Type : Bullish
Timeframe : Daily
Price is back over the pivot point
Type : Bullish
Timeframe : Weekly
An analysis of the price chart with the Central Patterns scanner (detector of chart patterns and resistances and supports) shows a result that can have an impact on the price change:
Resistance of triangle is broken
Type : Bullish
Timeframe : Daily
No result was found by the Central Candlesticks scanner on Japanese candlesticks.
| S3 | S2 | S1 | Price | R1 | R2 | R3 | |
|---|---|---|---|---|---|---|---|
| ProTrendLines | 29.9 | 32.4 | 33.4 | 34.0 | 35.5 | 48.8 | 64.0 |
| Change (%) | -12.06% | -4.71% | -1.76% | - | +4.41% | +43.53% | +88.24% |
| Change | -4.1 | -1.6 | -0.6 | - | +1.5 | +14.8 | +30.0 |
| Level | Minor | Intermediate | Major | - | Intermediate | Intermediate | Intermediate |
To determine price objectives, it is also possible to use the pivot points. Here is the price position in relation to pivot points:
| Pivot points | S3 | S2 | S1 | PP | R1 | R2 | R3 |
|---|---|---|---|---|---|---|---|
| Standard | 32.8 | 33.0 | 33.3 | 33.5 | 33.8 | 34.0 | 34.3 |
| Camarilla | 33.5 | 33.5 | 33.6 | 33.6 | 33.7 | 33.7 | 33.7 |
| Woodie | 32.9 | 33.0 | 33.4 | 33.5 | 33.9 | 34.0 | 34.4 |
| Fibonacci | 33.0 | 33.2 | 33.3 | 33.5 | 33.7 | 33.8 | 34.0 |
| Pivot points | S3 | S2 | S1 | PP | R1 | R2 | R3 |
|---|---|---|---|---|---|---|---|
| Standard | 32.6 | 32.9 | 33.4 | 33.7 | 34.2 | 34.5 | 35.0 |
| Camarilla | 33.6 | 33.7 | 33.7 | 33.8 | 33.9 | 34.0 | 34.0 |
| Woodie | 32.6 | 33.0 | 33.4 | 33.8 | 34.2 | 34.6 | 35.0 |
| Fibonacci | 32.9 | 33.2 | 33.4 | 33.7 | 34.0 | 34.2 | 34.5 |
| Pivot points | S3 | S2 | S1 | PP | R1 | R2 | R3 |
|---|---|---|---|---|---|---|---|
| Standard | 32.3 | 32.7 | 33.2 | 33.6 | 34.1 | 34.5 | 35.0 |
| Camarilla | 33.5 | 33.5 | 33.6 | 33.7 | 33.8 | 33.9 | 34.0 |
| Woodie | 32.4 | 32.7 | 33.3 | 33.6 | 34.2 | 34.5 | 35.1 |
| Fibonacci | 32.7 | 33.0 | 33.3 | 33.6 | 33.9 | 34.2 | 34.5 |
Numerical data
The following is the status of the technical indicators and moving averages at the time of publication of this technical analysis:
| RSI (14): | 61.10 | |
| MACD (12,26,9): | 0.1000 | |
| Directional Movement: | 14.7 | |
| AROON (14): | -35.8 | |
| DEMA (21): | 33.8 | |
| Parabolic SAR (0,02-0,02-0,2): | 34.1 | |
| Elder Ray (13): | 0 | |
| Super Trend (3,10): | 33.1 | |
| Zig ZAG (10): | 34.0 | |
| VORTEX (21): | 1.0000 | |
| Stochastique (14,3,5): | 65.30 | |
| TEMA (21): | 33.8 | |
| Williams %R (14): | -11.10 | |
| Chande Momentum Oscillator (20): | 0.5 | |
| Repulse (5,40,3): | 3.9000 | |
| ROCnROLL: | 1 | |
| TRIX (15,9): | 0.0000 | |
| Courbe Coppock: | 1.20 |
| MA7: | 33.8 | |
| MA20: | 33.7 | |
| MA50: | 33.6 | |
| MA100: | 33.4 | |
| MAexp7: | 33.8 | |
| MAexp20: | 33.7 | |
| MAexp50: | 33.5 | |
| MAexp100: | 32.6 | |
| Price / MA7: | +0.59% | |
| Price / MA20: | +0.89% | |
| Price / MA50: | +1.19% | |
| Price / MA100: | +1.80% | |
| Price / MAexp7: | +0.59% | |
| Price / MAexp20: | +0.89% | |
| Price / MAexp50: | +1.49% | |
| Price / MAexp100: | +4.29% |
News
The last news published on SNP SCHNEID.-NEUREIT.O.N. at the time of the generation of this analysis was as follows:
- EQS-News: PwC and SNP Expand Partnership Globally
- EQS-News: SNP: Public Takeover Offer Completed – Transition to Dualistic Management System Planned
- EQS-News: SNP continues on its growth path with order entry up by more than 30% in the second quarter – EBIT also increases significantly
- EQS-News: SNP SE reorganizes its Board of Directors
- EQS-News: Board of Directors and Managing Directors of SNP with neutral statement on voluntary public takeover offer
About author
Online


Add a comment
Comments
0 comments on the analysis SNP SCHNEID.-NEUREIT.O.N. - Daily