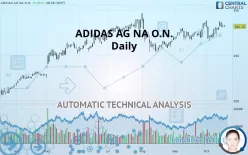
ADIDAS AG NA O.N. - Daily - Technical analysis published on 10/18/2019 (GMT)
- 369
- 0
- Who voted?
Click here for a new analysis!
- Timeframe : Daily
- - Analysis generated on
- Status : TARGET REACHED

Summary of the analysis

Additional analysis
Quotes
The ADIDAS AG NA O.N. price is 282.15 EUR. The price registered an increase of +0.05% on the session and was between 281.15 EUR and 283.90 EUR. This implies that the price is at +0.36% from its lowest and at -0.62% from its highest.The Central Gaps scanner detects a bullish opening. A small advantage for buyers in the very short term.
Bullish opening
Type : Bullish
Timeframe : Openning
Here is a more detailed summary of the historical variations registered by ADIDAS AG NA O.N.:
Near a new HIGH record (5 years)
Type : Bullish
Timeframe : Weekly
Near a new HIGH record (1 year)
Type : Bullish
Timeframe : Weekly
Near a new HIGH record (1st january)
Type : Bullish
Timeframe : Weekly
Near a new HIGH record (1 month)
Type : Bullish
Timeframe : Weekly
Technical
Technical analysis of ADIDAS AG NA O.N. in Daily shows a strongly overall bullish trend. 89.29% of the signals given by moving averages are bullish. This strongly bullish trend is supported by the strong bullish signals given by short-term moving averages. There is no crossing of moving average by the price or crossing of moving averages between themselves.
The technical indicators are bullish. There is still some doubt about the price increase.
Caution: the Central Indicators scanner currently detects an excess:
Williams %R indicator is overbought : over -20
Type : Neutral
Timeframe : Daily
Ichimoku - Bullish crossover : Tenkan & Kijun
Type : Bullish
Timeframe : Daily
Price is back over the pivot point
Type : Bullish
Timeframe : Weekly
An analysis of the price chart with the Central Patterns scanner (detector of chart patterns and resistances and supports) shows a result that can have an impact on the price change:
Support of triangle is broken
Type : Bearish
Timeframe : Daily
The Central Candlesticks scanner, specialised in Japanese candlesticks, did not identify any signals.
| S3 | S2 | S1 | Price | R1 | R2 | |
|---|---|---|---|---|---|---|
| ProTrendLines | 228.08 | 255.20 | 268.81 | 282.15 | 285.65 | 296.35 |
| Change (%) | -19.16% | -9.55% | -4.73% | - | +1.24% | +5.03% |
| Change | -54.07 | -26.95 | -13.34 | - | +3.50 | +14.20 |
| Level | Minor | Intermediate | Major | - | Intermediate | Major |
Pivot points can also be used to set your price objectives. Here is the price situation in relation to pivot points:
| Pivot points | S3 | S2 | S1 | PP | R1 | R2 | R3 |
|---|---|---|---|---|---|---|---|
| Standard | 276.68 | 279.07 | 280.53 | 282.92 | 284.38 | 286.77 | 288.23 |
| Camarilla | 280.94 | 281.29 | 281.65 | 282.00 | 282.35 | 282.71 | 283.06 |
| Woodie | 276.23 | 278.84 | 280.08 | 282.69 | 283.93 | 286.54 | 287.78 |
| Fibonacci | 279.07 | 280.54 | 281.45 | 282.92 | 284.39 | 285.30 | 286.77 |
| Pivot points | S3 | S2 | S1 | PP | R1 | R2 | R3 |
|---|---|---|---|---|---|---|---|
| Standard | 260.87 | 265.23 | 272.72 | 277.08 | 284.57 | 288.93 | 296.42 |
| Camarilla | 276.94 | 278.03 | 279.11 | 280.20 | 281.29 | 282.37 | 283.46 |
| Woodie | 262.43 | 266.01 | 274.28 | 277.86 | 286.13 | 289.71 | 297.98 |
| Fibonacci | 265.23 | 269.76 | 272.56 | 277.08 | 281.61 | 284.41 | 288.93 |
| Pivot points | S3 | S2 | S1 | PP | R1 | R2 | R3 |
|---|---|---|---|---|---|---|---|
| Standard | 252.62 | 259.48 | 272.57 | 279.43 | 292.52 | 299.38 | 312.47 |
| Camarilla | 280.16 | 281.99 | 283.82 | 285.65 | 287.48 | 289.31 | 291.14 |
| Woodie | 255.73 | 261.04 | 275.68 | 280.99 | 295.63 | 300.94 | 315.58 |
| Fibonacci | 259.48 | 267.10 | 271.81 | 279.43 | 287.05 | 291.76 | 299.38 |
Numerical data
The following are the details of the technical indicators and moving averages that were collected to generate this technical analysis:
| RSI (14): | 56.13 | |
| MACD (12,26,9): | 2.6200 | |
| Directional Movement: | 7.67 | |
| AROON (14): | -14.28 | |
| DEMA (21): | 281.38 | |
| Parabolic SAR (0,02-0,02-0,2): | 266.98 | |
| Elder Ray (13): | 2.98 | |
| Super Trend (3,10): | 267.37 | |
| Zig ZAG (10): | 282.00 | |
| VORTEX (21): | 1.0700 | |
| Stochastique (14,3,5): | 69.30 | |
| TEMA (21): | 282.66 | |
| Williams %R (14): | -30.13 | |
| Chande Momentum Oscillator (20): | -0.20 | |
| Repulse (5,40,3): | -0.7900 | |
| ROCnROLL: | 1 | |
| TRIX (15,9): | 0.1200 | |
| Courbe Coppock: | 3.33 |
| MA7: | 281.71 | |
| MA20: | 277.78 | |
| MA50: | 271.29 | |
| MA100: | 272.08 | |
| MAexp7: | 281.13 | |
| MAexp20: | 278.13 | |
| MAexp50: | 274.40 | |
| MAexp100: | 267.17 | |
| Price / MA7: | +0.16% | |
| Price / MA20: | +1.57% | |
| Price / MA50: | +4.00% | |
| Price / MA100: | +3.70% | |
| Price / MAexp7: | +0.36% | |
| Price / MAexp20: | +1.45% | |
| Price / MAexp50: | +2.82% | |
| Price / MAexp100: | +5.61% |
News
The latest news and videos published on ADIDAS AG NA O.N. at the time of the analysis were as follows:
-
 Adidas Transforming Ocean Plastic Into Sportswear
-
Adidas Appealing Insta-Users With Exclusive Maze Events
-
Adidas FAIL: Social media campaign to name Arsenal shirts after users gets hijacked
-
The Brief from Brussels: Socialists top Wallonia, Adidas loses its stripes
-
Adidas pierde la batalla de las tres bandas paralelas
About author

Online


Add a comment
Comments
0 comments on the analysis ADIDAS AG NA O.N. - Daily