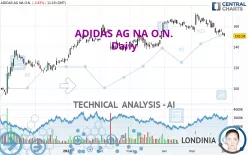
ADIDAS AG NA O.N. - Daily - Technical analysis published on 06/01/2023 (GMT)
- 202
- 0
Click here for a new analysis!
- Timeframe : Daily
- - Analysis generated on
- Status : INVALID

Summary of the analysis

Additional analysis
Quotes
The ADIDAS AG NA O.N. price is 150.24 EUR. On the day, this instrument lost -0.83% and was traded between 150.02 EUR and 153.36 EUR over the period. The price is currently at +0.15% from its lowest and -2.03% from its highest.The Central Gaps scanner detects a bullish opening. A small advantage for buyers in the very short term.
Bullish opening
Type : Bullish
Timeframe : Openning
Here is a more detailed summary of the historical variations registered by ADIDAS AG NA O.N.:
New LOW record (1 month)
Type : Bearish
Timeframe : Weekly
Technical
A technical analysis in Daily of this ADIDAS AG NA O.N. chart shows a slightly bearish trend. 53.57% of the signals given by moving averages are bearish. The overall trend could accelerate as a result of the strong bearish signals from short-term moving averages. The Central Indicators scanner detects bearish signals on moving averages that could impact this trend:
Bearish trend reversal : adaptative moving average 100
Type : Bearish
Timeframe : Daily
Bearish price crossover with Moving Average 100
Type : Bearish
Timeframe : Daily
Bearish price crossover with adaptative moving average 100
Type : Bearish
Timeframe : Daily
The probability of a further decline is moderate given the direction of the technical indicators.
Caution: the Central Indicators scanner currently detects an excess:
CCI indicator is oversold : under -100
Type : Neutral
Timeframe : Daily
Williams %R indicator is oversold : under -80
Type : Neutral
Timeframe : Daily
Pivot points : price is under support 1
Type : Neutral
Timeframe : Daily
Ichimoku : price is under the cloud
Type : Bearish
Timeframe : Daily
An analysis of the price chart with the Central Patterns scanner (detector of chart patterns and resistances and supports) shows a result that can have an impact on the price change:
Near support of channel
Type : Bullish
Timeframe : Daily
The Central Candlesticks scanner which studies Japanese candlesticks did not detect anything.
| S3 | S2 | S1 | Price | R1 | R2 | R3 | |
|---|---|---|---|---|---|---|---|
| ProTrendLines | 93.56 | 117.01 | 140.41 | 150.24 | 155.75 | 161.46 | 169.63 |
| Change (%) | -37.73% | -22.12% | -6.54% | - | +3.67% | +7.47% | +12.91% |
| Change | -56.68 | -33.23 | -9.83 | - | +5.51 | +11.22 | +19.39 |
| Level | Major | Intermediate | Major | - | Major | Major | Minor |
To determine price objectives, it is also possible to use the pivot points. Here is the price position in relation to pivot points:
| Pivot points | S3 | S2 | S1 | PP | R1 | R2 | R3 |
|---|---|---|---|---|---|---|---|
| Standard | 147.36 | 149.26 | 150.38 | 152.28 | 153.40 | 155.30 | 156.42 |
| Camarilla | 150.67 | 150.95 | 151.22 | 151.50 | 151.78 | 152.05 | 152.33 |
| Woodie | 146.97 | 149.07 | 149.99 | 152.09 | 153.01 | 155.11 | 156.03 |
| Fibonacci | 149.26 | 150.41 | 151.13 | 152.28 | 153.43 | 154.15 | 155.30 |
| Pivot points | S3 | S2 | S1 | PP | R1 | R2 | R3 |
|---|---|---|---|---|---|---|---|
| Standard | 138.49 | 144.97 | 150.21 | 156.69 | 161.93 | 168.41 | 173.65 |
| Camarilla | 152.22 | 153.29 | 154.37 | 155.44 | 156.51 | 157.59 | 158.66 |
| Woodie | 137.86 | 144.66 | 149.58 | 156.38 | 161.30 | 168.10 | 173.02 |
| Fibonacci | 144.97 | 149.45 | 152.22 | 156.69 | 161.17 | 163.94 | 168.41 |
| Pivot points | S3 | S2 | S1 | PP | R1 | R2 | R3 |
|---|---|---|---|---|---|---|---|
| Standard | 123.97 | 137.57 | 144.53 | 158.13 | 165.09 | 178.69 | 185.65 |
| Camarilla | 145.85 | 147.73 | 149.62 | 151.50 | 153.39 | 155.27 | 157.15 |
| Woodie | 120.66 | 135.91 | 141.22 | 156.47 | 161.78 | 177.03 | 182.34 |
| Fibonacci | 137.57 | 145.42 | 150.27 | 158.13 | 165.98 | 170.83 | 178.69 |
Numerical data
The following is the status of technical indicators and moving averages registered at the time this technical analysis was created:
| RSI (14): | 37.46 | |
| MACD (12,26,9): | -1.9000 | |
| Directional Movement: | -14.61 | |
| AROON (14): | -100.00 | |
| DEMA (21): | 155.82 | |
| Parabolic SAR (0,02-0,02-0,2): | 167.32 | |
| Elder Ray (13): | -4.50 | |
| Super Trend (3,10): | 164.17 | |
| Zig ZAG (10): | 150.06 | |
| VORTEX (21): | 0.8800 | |
| Stochastique (14,3,5): | 8.51 | |
| TEMA (21): | 152.38 | |
| Williams %R (14): | -99.88 | |
| Chande Momentum Oscillator (20): | -12.08 | |
| Repulse (5,40,3): | -4.6200 | |
| ROCnROLL: | 2 | |
| TRIX (15,9): | -0.0400 | |
| Courbe Coppock: | 12.54 |
| MA7: | 153.54 | |
| MA20: | 160.43 | |
| MA50: | 157.96 | |
| MA100: | 151.52 | |
| MAexp7: | 153.94 | |
| MAexp20: | 157.51 | |
| MAexp50: | 156.37 | |
| MAexp100: | 151.81 | |
| Price / MA7: | -2.15% | |
| Price / MA20: | -6.35% | |
| Price / MA50: | -4.89% | |
| Price / MA100: | -0.84% | |
| Price / MAexp7: | -2.40% | |
| Price / MAexp20: | -4.62% | |
| Price / MAexp50: | -3.92% | |
| Price / MAexp100: | -1.03% |
News
The latest news and videos published on ADIDAS AG NA O.N. at the time of the analysis were as follows:
- ADDYY LAWSUIT ALERT: Levi & Korsinsky Notifies adidas AG Investors of a Class Action Lawsuit and Upcoming Deadline
-
 Adidas resumes sale of Yeezy shoes
- SHAREHOLDER ALERT: Pomerantz Law Firm Investigates Claims On Behalf of Investors of adidas AG - ADDYY
- ADIDAS AG (OTC PINK: ADDDF, ADDYY) SHAREHOLDER CLASS ACTION ALERT: Bernstein Liebhard LLP Reminds Investors of the Deadline to File a Lead Plaintiff Motion in a Securities Class Action Lawsuit Against adidas AG
- ADDYY ALERT: The Klein Law Firm Announces a Lead Plaintiff Deadline of June 27, 2023 in the Class Action Filed on Behalf of adidas AG Shareholders
About author
Online


Add a comment
Comments
0 comments on the analysis ADIDAS AG NA O.N. - Daily