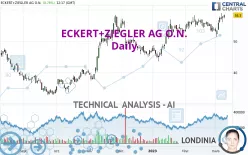
ECKERT+ZIEGLERINH O.N. - Daily - Technical analysis published on 03/09/2023 (GMT)
- 177
- 0
Click here for a new analysis!
- Timeframe : Daily
- - Analysis generated on
- Status : INVALID

Summary of the analysis

Additional analysis
Quotes
The ECKERT+ZIEGLER AG O.N. rating is 58.30 EUR. On the day, this instrument gained +0.78% and was traded between 57.35 EUR and 58.50 EUR over the period. The price is currently at +1.66% from its lowest and -0.34% from its highest.The Central Gaps scanner detects a bearish opening marking the presence of sellers ahead of buyers at the opening but not sufficiently marked to allow the price to register a quotation gap.
Bearish opening
Type : Bearish
Timeframe : Openning
Here is a more detailed summary of the historical variations registered by ECKERT+ZIEGLER AG O.N.:
Near a new HIGH record (1st january)
Type : Bullish
Timeframe : Weekly
Near a new HIGH record (1 month)
Type : Bullish
Timeframe : Weekly
Technical
A technical analysis in Daily of this ECKERT+ZIEGLER AG O.N. chart shows a strongly bullish trend. 92.86% of the signals given by moving averages are bullish. The overall trend is supported by the strong bullish signals from short-term moving averages. There is no crossing of moving average by the price or crossing of moving averages between themselves.
In fact, 14 technical indicators on 18 studied are currently bullish. But beware of excesses. The Central Indicators scanner currently detects this:
CCI indicator is overbought : over 100
Type : Neutral
Timeframe : Daily
Williams %R indicator is overbought : over -20
Type : Neutral
Timeframe : Daily
Pivot points : price is over resistance 1
Type : Neutral
Timeframe : Weekly
The Central Patterns scanner, which studies chart patterns, resistances and supports, has identified this signal:
Near horizontal resistance
Type : Bearish
Timeframe : Daily
The Central Candlesticks scanner which studies Japanese candlesticks did not detect anything.
| S3 | S2 | S1 | Price | R1 | R2 | R3 | |
|---|---|---|---|---|---|---|---|
| ProTrendLines | 46.84 | 49.90 | 57.95 | 58.30 | 89.17 | 103.74 | 135.75 |
| Change (%) | -19.66% | -14.41% | -0.60% | - | +52.95% | +77.94% | +132.85% |
| Change | -11.46 | -8.40 | -0.35 | - | +30.87 | +45.44 | +77.45 |
| Level | Intermediate | Major | Major | - | Minor | Minor | Major |
Pivot points can also be used to set your price objectives. Here is the price situation in relation to pivot points:
| Pivot points | S3 | S2 | S1 | PP | R1 | R2 | R3 |
|---|---|---|---|---|---|---|---|
| Standard | 54.58 | 55.32 | 56.58 | 57.32 | 58.58 | 59.32 | 60.58 |
| Camarilla | 57.30 | 57.48 | 57.67 | 57.85 | 58.03 | 58.22 | 58.40 |
| Woodie | 54.85 | 55.45 | 56.85 | 57.45 | 58.85 | 59.45 | 60.85 |
| Fibonacci | 55.32 | 56.08 | 56.55 | 57.32 | 58.08 | 58.55 | 59.32 |
| Pivot points | S3 | S2 | S1 | PP | R1 | R2 | R3 |
|---|---|---|---|---|---|---|---|
| Standard | 47.13 | 49.22 | 52.53 | 54.62 | 57.93 | 60.02 | 63.33 |
| Camarilla | 54.37 | 54.86 | 55.36 | 55.85 | 56.35 | 56.84 | 57.34 |
| Woodie | 47.75 | 49.53 | 53.15 | 54.93 | 58.55 | 60.33 | 63.95 |
| Fibonacci | 49.22 | 51.28 | 52.55 | 54.62 | 56.68 | 57.95 | 60.02 |
| Pivot points | S3 | S2 | S1 | PP | R1 | R2 | R3 |
|---|---|---|---|---|---|---|---|
| Standard | 46.67 | 49.88 | 51.87 | 55.08 | 57.07 | 60.28 | 62.27 |
| Camarilla | 52.42 | 52.90 | 53.37 | 53.85 | 54.33 | 54.80 | 55.28 |
| Woodie | 46.05 | 49.58 | 51.25 | 54.78 | 56.45 | 59.98 | 61.65 |
| Fibonacci | 49.88 | 51.87 | 53.10 | 55.08 | 57.07 | 58.30 | 60.28 |
Numerical data
The following is the status of technical indicators and moving averages registered at the time this technical analysis was created:
| RSI (14): | 65.97 | |
| MACD (12,26,9): | 0.9300 | |
| Directional Movement: | 8.81 | |
| AROON (14): | 21.42 | |
| DEMA (21): | 56.88 | |
| Parabolic SAR (0,02-0,02-0,2): | 52.43 | |
| Elder Ray (13): | 1.78 | |
| Super Trend (3,10): | 52.59 | |
| Zig ZAG (10): | 58.40 | |
| VORTEX (21): | 1.0300 | |
| Stochastique (14,3,5): | 86.36 | |
| TEMA (21): | 56.84 | |
| Williams %R (14): | -7.79 | |
| Chande Momentum Oscillator (20): | 2.40 | |
| Repulse (5,40,3): | 5.2300 | |
| ROCnROLL: | 1 | |
| TRIX (15,9): | 0.1800 | |
| Courbe Coppock: | 2.12 |
| MA7: | 56.26 | |
| MA20: | 55.65 | |
| MA50: | 53.34 | |
| MA100: | 50.31 | |
| MAexp7: | 56.85 | |
| MAexp20: | 55.68 | |
| MAexp50: | 53.67 | |
| MAexp100: | 50.80 | |
| Price / MA7: | +3.63% | |
| Price / MA20: | +4.76% | |
| Price / MA50: | +9.30% | |
| Price / MA100: | +15.88% | |
| Price / MAexp7: | +2.55% | |
| Price / MAexp20: | +4.71% | |
| Price / MAexp50: | +8.63% | |
| Price / MAexp100: | +14.76% |
News
The latest news and videos published on ECKERT+ZIEGLER AG O.N. at the time of the analysis were as follows:
- EQS-News: Eckert & Ziegler Submits Drug Master File for Lu-177 n.c.a.
- EQS-News: Lausanne University Hospital Investigates Use of PENTIXAFOR in Cardio-Vascular Setting
- EQS-Adhoc: Eckert & Ziegler Exceeds Forecast for the 2022 Financial Year According to Preliminary Figures
- EQS-News: Change in the Supervisory Board of Eckert & Ziegler AG
- EQS-Adhoc: Changes in the Management Board of Eckert & Ziegler
About author
Online


Add a comment
Comments
0 comments on the analysis ECKERT+ZIEGLERINH O.N. - Daily