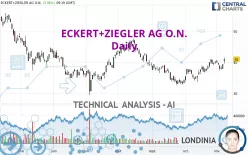
ECKERT+ZIEGLERINH O.N. - Daily - Technical analysis published on 11/08/2022 (GMT)
- 162
- 0
Click here for a new analysis!
- Timeframe : Daily
- - Analysis generated on
- Status : TARGET REACHED

Summary of the analysis

Additional analysis
Quotes
The ECKERT+ZIEGLER AG O.N. price is 41.00 EUR. The price has increased by +3.96% since the last closing with the lowest point at 39.66 EUR and the highest point at 41.50 EUR. The deviation from the price is +3.38% for the low point and -1.20% for the high point.The Central Gaps scanner detects the formation of a bullish gap marking the strong presence of buyers against sellers at the opening. This formed a quotation gap.
Opening Gap UP
Type : Bullish
Timeframe : Openning
A study of price movements over other periods shows the following variations:
Near a new HIGH record (1 month)
Type : Bullish
Timeframe : Weekly
Technical
A technical analysis in Daily of this ECKERT+ZIEGLER AG O.N. chart shows a bullish trend. The signals returned by the moving averages are 78.57% bullish. This bullish trend is reinforced by the strong signals currently being given by short-term moving averages. The Central Indicators market scanner is currently detecting a bullish signal that could impact this trend:
Bullish trend reversal : adaptative moving average 20
Type : Bullish
Timeframe : Daily
The probability of a further increase is high given the direction of the technical indicators.
Caution: the Central Indicators scanner currently detects an excess:
CCI indicator is overbought : over 100
Type : Neutral
Timeframe : Daily
Williams %R indicator is overbought : over -20
Type : Neutral
Timeframe : Daily
Pivot points : price is over resistance 1
Type : Neutral
Timeframe : Weekly
Pivot points : price is over resistance 2
Type : Neutral
Timeframe : Daily
MACD crosses UP its Moving Average
Type : Bullish
Timeframe : Daily
Parabolic SAR indicator bullish reversal
Type : Bullish
Timeframe : Daily
Ichimoku : price is over the cloud
Type : Bullish
Timeframe : Daily
Central Patterns, the market scanner focusing on chart patterns, resistances and supports found these results:
Resistance of channel is broken
Type : Bullish
Timeframe : Daily
Resistance of triangle is broken
Type : Bullish
Timeframe : Daily
For a small rebound in the very short term, the Central Candlesticks scanner currently notes the presence of this bullish pattern in Japanese candlesticks:
Upside gap
Type : Bullish
Timeframe : Daily
| S3 | S2 | S1 | Price | R1 | R2 | R3 | |
|---|---|---|---|---|---|---|---|
| ProTrendLines | 24.36 | 30.66 | 37.79 | 41.00 | 49.90 | 62.74 | 72.32 |
| Change (%) | -40.59% | -25.22% | -7.83% | - | +21.71% | +53.02% | +76.39% |
| Change | -16.64 | -10.34 | -3.21 | - | +8.90 | +21.74 | +31.32 |
| Level | Major | Minor | Major | - | Major | Intermediate | Minor |
Pivot points can also be used to set your price objectives. Here is the price situation in relation to pivot points:
| Pivot points | S3 | S2 | S1 | PP | R1 | R2 | R3 |
|---|---|---|---|---|---|---|---|
| Standard | 36.77 | 37.31 | 38.37 | 38.91 | 39.97 | 40.51 | 41.57 |
| Camarilla | 39.00 | 39.15 | 39.29 | 39.44 | 39.59 | 39.73 | 39.88 |
| Woodie | 37.04 | 37.44 | 38.64 | 39.04 | 40.24 | 40.64 | 41.84 |
| Fibonacci | 37.31 | 37.92 | 38.30 | 38.91 | 39.52 | 39.90 | 40.51 |
| Pivot points | S3 | S2 | S1 | PP | R1 | R2 | R3 |
|---|---|---|---|---|---|---|---|
| Standard | 33.33 | 35.35 | 36.81 | 38.83 | 40.29 | 42.31 | 43.77 |
| Camarilla | 37.32 | 37.64 | 37.96 | 38.28 | 38.60 | 38.92 | 39.24 |
| Woodie | 33.06 | 35.21 | 36.54 | 38.69 | 40.02 | 42.17 | 43.50 |
| Fibonacci | 35.35 | 36.68 | 37.50 | 38.83 | 40.16 | 40.98 | 42.31 |
| Pivot points | S3 | S2 | S1 | PP | R1 | R2 | R3 |
|---|---|---|---|---|---|---|---|
| Standard | 28.03 | 30.85 | 35.45 | 38.27 | 42.87 | 45.69 | 50.29 |
| Camarilla | 38.00 | 38.68 | 39.36 | 40.04 | 40.72 | 41.40 | 42.08 |
| Woodie | 28.91 | 31.30 | 36.33 | 38.72 | 43.75 | 46.14 | 51.17 |
| Fibonacci | 30.85 | 33.69 | 35.44 | 38.27 | 41.11 | 42.86 | 45.69 |
Numerical data
The following are the details of the technical indicators and moving averages that were collected to generate this technical analysis:
| RSI (14): | 62.78 | |
| MACD (12,26,9): | 0.7700 | |
| Directional Movement: | 12.14 | |
| AROON (14): | 92.86 | |
| DEMA (21): | 39.66 | |
| Parabolic SAR (0,02-0,02-0,2): | 37.36 | |
| Elder Ray (13): | 1.46 | |
| Super Trend (3,10): | 36.31 | |
| Zig ZAG (10): | 41.44 | |
| VORTEX (21): | 1.1300 | |
| Stochastique (14,3,5): | 61.93 | |
| TEMA (21): | 40.32 | |
| Williams %R (14): | -10.97 | |
| Chande Momentum Oscillator (20): | 3.64 | |
| Repulse (5,40,3): | 6.8700 | |
| ROCnROLL: | 1 | |
| TRIX (15,9): | 0.2800 | |
| Courbe Coppock: | 13.08 |
| MA7: | 39.42 | |
| MA20: | 38.58 | |
| MA50: | 37.22 | |
| MA100: | 38.64 | |
| MAexp7: | 39.51 | |
| MAexp20: | 38.73 | |
| MAexp50: | 38.35 | |
| MAexp100: | 40.60 | |
| Price / MA7: | +4.01% | |
| Price / MA20: | +6.27% | |
| Price / MA50: | +10.16% | |
| Price / MA100: | +6.11% | |
| Price / MAexp7: | +3.77% | |
| Price / MAexp20: | +5.86% | |
| Price / MAexp50: | +6.91% | |
| Price / MAexp100: | +0.99% |
News
The latest news and videos published on ECKERT+ZIEGLER AG O.N. at the time of the analysis were as follows:
- EQS-News: Eckert & Ziegler: Nine-Month Figures Show Strong Sales Growth
- EQS-News: First CNS Lymphoma Patient Imaged with PentixaFor in Phase 2 Trial
- EQS-News: Eckert & Ziegler and Alpha-9 Sign Actinium-225 (Ac-225) Reservation Agreement
- EQS-News: Eckert & Ziegler to Build Production Line for NorthStar Medical Radioisotopes’ Dedicated Actinium-225 Production Facility
- DGAP-News: Eckert & Ziegler with Successful First Half of 2022
About author
Online


Add a comment
Comments
0 comments on the analysis ECKERT+ZIEGLERINH O.N. - Daily