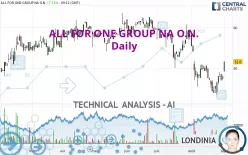
ALL FOR ONE GROUP NA O.N. - Daily - Technical analysis published on 09/02/2024 (GMT)
- 122
- 0
Click here for a new analysis!
- Timeframe : Daily
- - Analysis generated on
- Status : TARGET REACHED

Summary of the analysis

Additional analysis
Quotes
The ALL FOR ONE GROUP NA O.N. price is 51.6 EUR. The price has increased by +7.72% since the last closing and was traded between 49.2 EUR and 51.6 EUR over the period. The price is currently at +4.88% from its lowest and 0% from its highest.The Central Gaps scanner detects the formation of a bullish gap marking the strong presence of buyers against sellers at the opening. This formed a quotation gap.
Opening Gap UP
Type : Bullish
Timeframe : Openning
So that you have an overall view of the price change, here is a table showing the variations over several periods:
Technical
Technical analysis of this Daily chart of ALL FOR ONE GROUP NA O.N. indicates that the overall trend is bearish. 71.43% of the signals given by moving averages are bearish. Caution: the neutral signals currently given by short-term moving averages show us that the global trend is losing momentum. The Central Indicators market scanner is currently detecting several bullish signals that could impact this trend:
Bullish price crossover with adaptative moving average 20
Type : Bullish
Timeframe : Daily
Bullish price crossover with adaptative moving average 50
Type : Bullish
Timeframe : Daily
In fact, 12 technical indicators on 18 studied are currently bullish. But beware of excesses. The Central Indicators scanner currently detects this:
Williams %R indicator is overbought : over -20
Type : Neutral
Timeframe : Daily
Pivot points : price is over resistance 3
Type : Neutral
Timeframe : Daily
RSI indicator is back over 50
Type : Bullish
Timeframe : Daily
Parabolic SAR indicator bullish reversal
Type : Bullish
Timeframe : Daily
Momentum indicator is back over 0
Type : Bullish
Timeframe : Daily
Central Patterns, the market scanner focusing on chart patterns, resistances and supports found this result:
Horizontal resistance is broken
Type : Bullish
Timeframe : Daily
For a small rebound in the very short term, the Central Candlesticks scanner currently notes the presence of this bullish pattern in Japanese candlesticks:
Upside gap
Type : Bullish
Timeframe : Daily
| S3 | S2 | S1 | Price | R1 | R2 | R3 | |
|---|---|---|---|---|---|---|---|
| ProTrendLines | 45.9 | 48.4 | 50.9 | 51.6 | 55.0 | 62.6 | 69.0 |
| Change (%) | -11.05% | -6.20% | -1.36% | - | +6.59% | +21.32% | +33.72% |
| Change | -5.7 | -3.2 | -0.7 | - | +3.4 | +11.0 | +17.4 |
| Level | Major | Minor | Minor | - | Major | Major | Major |
To determine price objectives, it is also possible to use the pivot points. Here is the price position in relation to pivot points:
| Pivot points | S3 | S2 | S1 | PP | R1 | R2 | R3 |
|---|---|---|---|---|---|---|---|
| Standard | 45.9 | 46.4 | 47.2 | 47.7 | 48.5 | 49.0 | 49.8 |
| Camarilla | 47.5 | 47.7 | 47.8 | 47.9 | 48.0 | 48.1 | 48.3 |
| Woodie | 46.0 | 46.5 | 47.3 | 47.8 | 48.6 | 49.1 | 49.9 |
| Fibonacci | 46.4 | 46.9 | 47.2 | 47.7 | 48.2 | 48.5 | 49.0 |
| Pivot points | S3 | S2 | S1 | PP | R1 | R2 | R3 |
|---|---|---|---|---|---|---|---|
| Standard | 38.8 | 41.0 | 44.5 | 46.7 | 50.2 | 52.4 | 55.9 |
| Camarilla | 46.3 | 46.9 | 47.4 | 47.9 | 48.4 | 49.0 | 49.5 |
| Woodie | 39.4 | 41.3 | 45.1 | 47.0 | 50.8 | 52.7 | 56.5 |
| Fibonacci | 41.0 | 43.2 | 44.6 | 46.7 | 48.9 | 50.3 | 52.4 |
| Pivot points | S3 | S2 | S1 | PP | R1 | R2 | R3 |
|---|---|---|---|---|---|---|---|
| Standard | 26.5 | 34.9 | 41.4 | 49.8 | 56.3 | 64.7 | 71.2 |
| Camarilla | 43.8 | 45.2 | 46.5 | 47.9 | 49.3 | 50.6 | 52.0 |
| Woodie | 25.6 | 34.4 | 40.5 | 49.3 | 55.4 | 64.2 | 70.3 |
| Fibonacci | 34.9 | 40.6 | 44.1 | 49.8 | 55.5 | 59.0 | 64.7 |
Numerical data
The following is the status of the technical indicators and moving averages at the time of publication of this technical analysis:
| RSI (14): | 51.50 | |
| MACD (12,26,9): | -1.6000 | |
| Directional Movement: | -5.4 | |
| AROON (14): | -64.3 | |
| DEMA (21): | 46.3 | |
| Parabolic SAR (0,02-0,02-0,2): | 43.3 | |
| Elder Ray (13): | 1.7 | |
| Super Trend (3,10): | 50.7 | |
| Zig ZAG (10): | 50.0 | |
| VORTEX (21): | 0.9000 | |
| Stochastique (14,3,5): | 68.00 | |
| TEMA (21): | 46.6 | |
| Williams %R (14): | -8.20 | |
| Chande Momentum Oscillator (20): | 0.5 | |
| Repulse (5,40,3): | 2.4000 | |
| ROCnROLL: | -1 | |
| TRIX (15,9): | -0.6000 | |
| Courbe Coppock: | 8.30 |
| MA7: | 47.5 | |
| MA20: | 47.8 | |
| MA50: | 53.2 | |
| MA100: | 56.3 | |
| MAexp7: | 47.9 | |
| MAexp20: | 48.7 | |
| MAexp50: | 51.9 | |
| MAexp100: | 53.5 | |
| Price / MA7: | +8.63% | |
| Price / MA20: | +7.95% | |
| Price / MA50: | -3.01% | |
| Price / MA100: | -8.35% | |
| Price / MAexp7: | +7.72% | |
| Price / MAexp20: | +5.95% | |
| Price / MAexp50: | -0.58% | |
| Price / MAexp100: | -3.55% |
News
Don't forget to follow the news on ALL FOR ONE GROUP NA O.N.. At the time of publication of this analysis, the latest news was as follows:
- EQS-News: Strong order intake // Significant sales growth in the CORE segment // Management board confirms guidance for 2023/24 despite challenges
- EQS-News: Significant growth in sales and operating result in H1 2023/24 // Strong order inflow // Management board confirms guidance for 2023/24
- EQS-News: All for One Group SE reaffirms growth trajectory in SAP market as a recognised specialist for SMEs, industries and the cloud
- All for One Group strengthens its position as a leading SAP RISE partner by introducing the »RISE ONE Service Center«
- EQS-News: All for One Group SE to pay a dividend of 1.45 euros // Guidance for financial year 2023/24 confirmed
About author
Online


Add a comment
Comments
0 comments on the analysis ALL FOR ONE GROUP NA O.N. - Daily