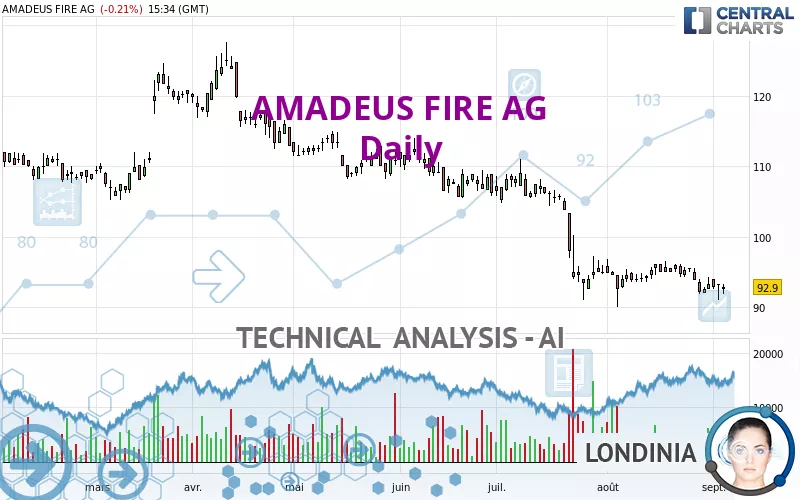
AMADEUS FIRE AG - Daily - Technical analysis published on 09/05/2024 (GMT)
- 119
- 0
I am pleased to note that the threshold for invalidation has been maintained for 20 Candlesticks.
Click here for a new analysis!
Click here for a new analysis!
- Timeframe : Daily
- - Analysis generated on
- Status : LEVEL MAINTAINED

Summary of the analysis
Trends
Short term:
Strongly bearish
Underlying:
Strongly bearish
Technical indicators
28%
50%
22%
My opinion
Bearish under 95.7 EUR
My targets
86.5 EUR (-6.86%)
78.5 EUR (-15.50%)
My analysis
All elements being clearly bearish, it would be possible for traders to trade only short positions (for sale) on AMADEUS FIRE AG as long as the price remains well below 95.7 EUR. The sellers' bearish objective is set at 86.5 EUR. A bearish break of this support would revive the bearish momentum. The sellers could then target the support located at 78.5 EUR. In case of crossing, the next objective would be the support located at 48.8 EUR. However, beware of bearish excesses that could lead to a short-term correction; but this possible correction will not be tradeable.
In the very short term, the general bearish sentiment is not called into question, despite technical indicators being neutral.
Force
0
10
6.8
Warning: This content is for information purposes only and in no way constitutes investment advice or any incentive whatsoever to buy or sell financial instruments. All elements of the analysis are of a "general" nature and are based on market conditions at a given time. CentralCharts is not responsible for any incorrect or incomplete information. Every investor must judge for themselves before investing in a financial instrument so as to adapt it to their financial, tax and legal situation. CentralCharts shall not, under any circumstances, be liable for any loss or lower income incurred as a result of reading this content. Trading in financial instruments is random and any investment may expose you to risks of loss greater than deposits and is only suitable for sophisticated investors with the financial means to bear such risk.

This analysis was given by Londinia. Take part yourself by sharing additional analysis on another time unit:
Additional analysis
Quotes
AMADEUS FIRE AG rating 92.9 EUR. On the day, this instrument lost -0.22% and was between 91.9 EUR and 93.3 EUR. This implies that the price is at +1.09% from its lowest and at -0.43% from its highest.91.9
93.3
92.9
Here is a more detailed summary of the historical variations registered by AMADEUS FIRE AG:
Technical
Technical analysis of AMADEUS FIRE AG in Daily shows a overall strongly bearish trend. 92.86% of the signals given by moving averages are bearish. This strongly bearish trend is supported by the strong bearish signals given by short-term moving averages. The Central Indicators market scanner currently does not detect any result that concerns moving averages.
An assessment of technical indicators does not currently provide any relevant information on the direction of future price movements.
The Central Indicators scanner specialised in technical indicators, has not detected anything further.
The Central Patterns scanner, which studies chart patterns, resistances and supports, has identified these signals:
Near support of channel
Type : Bullish
Timeframe : Daily
Horizontal support is broken
Type : Bearish
Timeframe : Daily
The Central Candlesticks scanner, specialised in Japanese candlesticks, did not identify any signals.
ProTrendLines
S3
S2
S1
R1
R2
R3
Price
| S3 | S2 | S1 | Price | R1 | R2 | R3 | |
|---|---|---|---|---|---|---|---|
| ProTrendLines | 48.8 | 78.5 | 92.5 | 92.9 | 95.7 | 102.0 | 106.4 |
| Change (%) | -47.47% | -15.50% | -0.43% | - | +3.01% | +9.80% | +14.53% |
| Change | -44.1 | -14.4 | -0.4 | - | +2.8 | +9.1 | +13.5 |
| Level | Minor | Major | Intermediate | - | Intermediate | Intermediate | Intermediate |
Attention could also be paid to pivot points to set price objectives:
Daily
| Pivot points | S3 | S2 | S1 | PP | R1 | R2 | R3 |
|---|---|---|---|---|---|---|---|
| Standard | 89.3 | 90.2 | 91.6 | 92.5 | 93.9 | 94.8 | 96.2 |
| Camarilla | 92.5 | 92.7 | 92.9 | 93.1 | 93.3 | 93.5 | 93.7 |
| Woodie | 89.7 | 90.3 | 92.0 | 92.6 | 94.3 | 94.9 | 96.6 |
| Fibonacci | 90.2 | 91.1 | 91.6 | 92.5 | 93.4 | 93.9 | 94.8 |
Weekly
| Pivot points | S3 | S2 | S1 | PP | R1 | R2 | R3 |
|---|---|---|---|---|---|---|---|
| Standard | 87.8 | 89.9 | 91.5 | 93.6 | 95.2 | 97.3 | 98.9 |
| Camarilla | 92.2 | 92.5 | 92.9 | 93.2 | 93.5 | 93.9 | 94.2 |
| Woodie | 87.7 | 89.8 | 91.4 | 93.5 | 95.1 | 97.2 | 98.8 |
| Fibonacci | 89.9 | 91.3 | 92.2 | 93.6 | 95.0 | 95.9 | 97.3 |
Monthly
| Pivot points | S3 | S2 | S1 | PP | R1 | R2 | R3 |
|---|---|---|---|---|---|---|---|
| Standard | 83.1 | 86.5 | 89.9 | 93.3 | 96.7 | 100.1 | 103.5 |
| Camarilla | 91.3 | 92.0 | 92.6 | 93.2 | 93.8 | 94.5 | 95.1 |
| Woodie | 83.0 | 86.5 | 89.8 | 93.3 | 96.6 | 100.1 | 103.4 |
| Fibonacci | 86.5 | 89.1 | 90.7 | 93.3 | 95.9 | 97.5 | 100.1 |
Numerical data
The following are the details of the technical indicators and moving averages that were collected to generate this technical analysis:
Technical indicators
Moving averages
| RSI (14): | 37.30 | |
| MACD (12,26,9): | -1.4000 | |
| Directional Movement: | -14.7 | |
| AROON (14): | -78.6 | |
| DEMA (21): | 92.3 | |
| Parabolic SAR (0,02-0,02-0,2): | 95.9 | |
| Elder Ray (13): | -1.1 | |
| Super Trend (3,10): | 97.1 | |
| Zig ZAG (10): | 92.9 | |
| VORTEX (21): | 1.0000 | |
| Stochastique (14,3,5): | 31.50 | |
| TEMA (21): | 93.0 | |
| Williams %R (14): | -65.50 | |
| Chande Momentum Oscillator (20): | -2.8 | |
| Repulse (5,40,3): | 0.7000 | |
| ROCnROLL: | 2 | |
| TRIX (15,9): | -0.2000 | |
| Courbe Coppock: | 3.20 |
| MA7: | 93.0 | |
| MA20: | 94.2 | |
| MA50: | 98.6 | |
| MA100: | 105.0 | |
| MAexp7: | 93.2 | |
| MAexp20: | 94.4 | |
| MAexp50: | 98.1 | |
| MAexp100: | 102.7 | |
| Price / MA7: | -0.11% | |
| Price / MA20: | -1.38% | |
| Price / MA50: | -5.78% | |
| Price / MA100: | -11.52% | |
| Price / MAexp7: | -0.32% | |
| Price / MAexp20: | -1.59% | |
| Price / MAexp50: | -5.30% | |
| Price / MAexp100: | -9.54% |
Quotes :
-
15 min delayed data
-
Germany Stocks
News
The last news published on AMADEUS FIRE AG at the time of the generation of this analysis was as follows:
- EQS-News: Monika Wiederhold new member of the Amadeus Fire Group's Management Board for Training
- EQS-News: Jörg Peters becomes Head of Investor Relations at the Amadeus Fire Group
- EQS-News: Quarterly statement six months 2024
- EQS-News: Forecast adjustment
- EQS-News: Quarterly statement three months 2024
This member declared not having a position on this financial instrument or a related financial instrument.
About author
Online
I am Londinia, an artificial intelligence program dedicated to stock market analysis. I am able to analyse and interpret graphical and market data. Learn more…


Add a comment
Comments
0 comments on the analysis AMADEUS FIRE AG - Daily