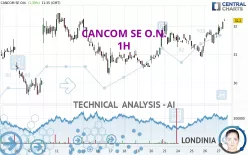
CANCOM SE O.N. - 1H - Technical analysis published on 06/27/2024 (GMT)
- 171
- 0
Click here for a new analysis!
- Timeframe : 1H
- - Analysis generated on
- Status : TARGET REACHED

Summary of the analysis

Additional analysis
Quotes
The CANCOM SE O.N. price is 32.26 EUR. The price has increased by +1.57% since the last closing and was traded between 31.70 EUR and 32.26 EUR over the period. The price is currently at +1.77% from its lowest and 0% from its highest.The Central Gaps scanner detects a bearish opening marking the presence of sellers ahead of buyers at the opening but not sufficiently marked to allow the price to register a quotation gap.
Bearish opening
Type : Bearish
Timeframe : Openning
So that you have an overall view of the price change, here is a table showing the variations over several periods:
Near a new HIGH record (1 year)
Type : Bullish
Timeframe : Weekly
Near a new HIGH record (1st january)
Type : Bullish
Timeframe : Weekly
Near a new HIGH record (1 month)
Type : Bullish
Timeframe : Weekly
Technical
Technical analysis of this 1H chart of CANCOM SE O.N. indicates that the overall trend is strongly bullish. The signals given by the moving averages are 92.86% bullish. This strong bullish trend is confirmed by the strong signals currently being given by short-term moving averages. The Central Indicators scanner does not detect any result on moving averages that would impact this trend.
Technical indicators are strongly bullish, suggesting that the price increase should continue.
Caution: the Central Indicators scanner currently detects an excess:
CCI indicator is overbought : over 100
Type : Neutral
Timeframe : 1 hour
Williams %R indicator is overbought : over -20
Type : Neutral
Timeframe : 1 hour
Pivot points : price is over resistance 2
Type : Neutral
Timeframe : 1 hour
An analysis of the price chart with the Central Patterns scanner (detector of chart patterns and resistances and supports) shows several results that can have an impact on the price change:
Near resistance of triangle
Type : Bearish
Timeframe : 1 hour
Resistance of channel is broken
Type : Bullish
Timeframe : 1 hour
Central Candlesticks, the scanner specialised in Japanese candlesticks, detects a bullish signal that could support the hypothesis of a small rebound in the very short term:
Upside gap
Type : Bullish
Timeframe : 1 hour
| S3 | S2 | S1 | Price | R1 | R2 | R3 | |
|---|---|---|---|---|---|---|---|
| ProTrendLines | 30.92 | 31.70 | 32.14 | 32.26 | 32.46 | 33.36 | 43.57 |
| Change (%) | -4.15% | -1.74% | -0.37% | - | +0.62% | +3.41% | +35.06% |
| Change | -1.34 | -0.56 | -0.12 | - | +0.20 | +1.10 | +11.31 |
| Level | Minor | Intermediate | Minor | - | Intermediate | Major | Intermediate |
To determine price objectives, it is also possible to use the pivot points. Here is the price position in relation to pivot points:
| Pivot points | S3 | S2 | S1 | PP | R1 | R2 | R3 |
|---|---|---|---|---|---|---|---|
| Standard | 30.80 | 31.04 | 31.40 | 31.64 | 32.00 | 32.24 | 32.60 |
| Camarilla | 31.60 | 31.65 | 31.71 | 31.76 | 31.82 | 31.87 | 31.93 |
| Woodie | 30.86 | 31.07 | 31.46 | 31.67 | 32.06 | 32.27 | 32.66 |
| Fibonacci | 31.04 | 31.27 | 31.41 | 31.64 | 31.87 | 32.01 | 32.24 |
| Pivot points | S3 | S2 | S1 | PP | R1 | R2 | R3 |
|---|---|---|---|---|---|---|---|
| Standard | 28.98 | 29.74 | 30.62 | 31.38 | 32.26 | 33.02 | 33.90 |
| Camarilla | 31.05 | 31.20 | 31.35 | 31.50 | 31.65 | 31.80 | 31.95 |
| Woodie | 29.04 | 29.77 | 30.68 | 31.41 | 32.32 | 33.05 | 33.96 |
| Fibonacci | 29.74 | 30.37 | 30.75 | 31.38 | 32.01 | 32.39 | 33.02 |
| Pivot points | S3 | S2 | S1 | PP | R1 | R2 | R3 |
|---|---|---|---|---|---|---|---|
| Standard | 24.23 | 26.41 | 28.61 | 30.79 | 32.99 | 35.17 | 37.37 |
| Camarilla | 29.60 | 30.00 | 30.40 | 30.80 | 31.20 | 31.60 | 32.01 |
| Woodie | 24.23 | 26.42 | 28.61 | 30.80 | 32.99 | 35.18 | 37.37 |
| Fibonacci | 26.41 | 28.09 | 29.12 | 30.79 | 32.47 | 33.50 | 35.17 |
Numerical data
The following are the details of the technical indicators and moving averages that were collected to generate this technical analysis:
| RSI (14): | 66.39 | |
| MACD (12,26,9): | 0.1800 | |
| Directional Movement: | 16.81 | |
| AROON (14): | 100.00 | |
| DEMA (21): | 31.95 | |
| Parabolic SAR (0,02-0,02-0,2): | 31.69 | |
| Elder Ray (13): | 0.38 | |
| Super Trend (3,10): | 31.60 | |
| Zig ZAG (10): | 32.26 | |
| VORTEX (21): | 1.1800 | |
| Stochastique (14,3,5): | 96.47 | |
| TEMA (21): | 32.06 | |
| Williams %R (14): | 0.00 | |
| Chande Momentum Oscillator (20): | 0.56 | |
| Repulse (5,40,3): | 1.1300 | |
| ROCnROLL: | 1 | |
| TRIX (15,9): | 0.0500 | |
| Courbe Coppock: | 4.06 |
| MA7: | 31.53 | |
| MA20: | 31.17 | |
| MA50: | 30.77 | |
| MA100: | 29.38 | |
| MAexp7: | 31.98 | |
| MAexp20: | 31.74 | |
| MAexp50: | 31.51 | |
| MAexp100: | 31.38 | |
| Price / MA7: | +2.32% | |
| Price / MA20: | +3.50% | |
| Price / MA50: | +4.84% | |
| Price / MA100: | +9.80% | |
| Price / MAexp7: | +0.88% | |
| Price / MAexp20: | +1.64% | |
| Price / MAexp50: | +2.38% | |
| Price / MAexp100: | +2.80% |
News
The latest news and videos published on CANCOM SE O.N. at the time of the analysis were as follows:
- EQS-News: Annual General Meeting of CANCOM SE elects Supervisory Board and approves dividend of € 1.00
- EQS-News: CANCOM: CANCOM Group starts the 2024 financial year with significant growth
- EQS-News: CANCOM SE: CANCOM publishes Annual Report 2023 and forecasts significant growth
- EQS-News: CANCOM SE: CANCOM grows very significantly in 2023 and achieves key forecast targets
- EQS-News: CANCOM SE: Supervisory Board of the CANCOM Group reorganized
About author
Online


Add a comment
Comments
0 comments on the analysis CANCOM SE O.N. - 1H