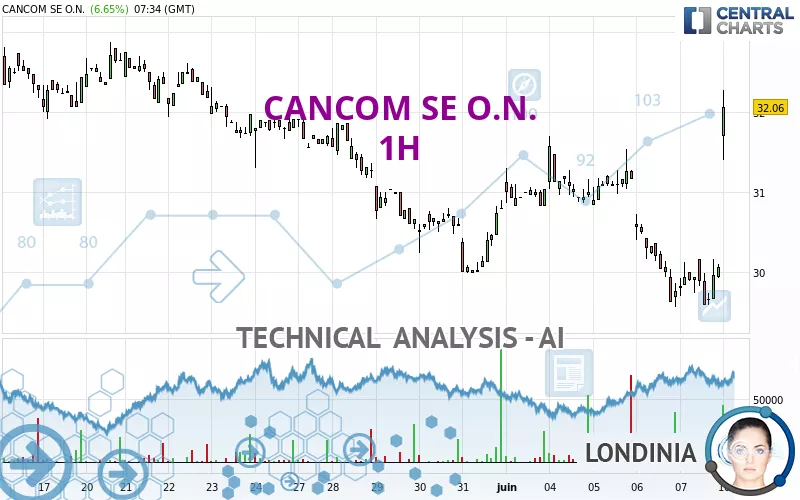
CANCOM SE O.N. - 1H - Technical analysis published on 06/10/2024 (GMT)
- 163
- 0
Click here for a new analysis!
- Timeframe : 1H
- - Analysis generated on
- Status : INVALID
Summary of the analysis

Additional analysis
Quotes
The CANCOM SE O.N. price is 31.94 EUR. On the day, this instrument gained +6.25% with the lowest point at 31.40 EUR and the highest point at 32.28 EUR. The deviation from the price is +1.72% for the low point and -1.05% for the high point.The Central Gaps scanner detects a bullish gap which is a sign that buyers have taken the lead in the very short term.
Opening Gap UP
Type : Bullish
Timeframe : Openning
So that you have an overall view of the price change, here is a table showing the variations over several periods:
Near a new LOW record (1 month)
Type : Bearish
Timeframe : Weekly
Technical
Technical analysis of this 1H chart of CANCOM SE O.N. indicates that the overall trend is bullish. 71.43% of the signals given by moving averages are bullish. The overall trend is reinforced by the strong bullish signals from short-term moving averages. The Central Indicators scanner detects bullish signals on moving averages that could impact this trend:
Bullish trend reversal : Moving Average 50
Type : Bullish
Timeframe : 1 hour
Moving Average bullish crossovers : AMA50 & AMA100
Type : Bullish
Timeframe : 1 hour
Bullish price crossover with Moving Average 20
Type : Bullish
Timeframe : 1 hour
Bullish price crossover with Moving Average 50
Type : Bullish
Timeframe : 1 hour
Bullish price crossover with Moving Average 100
Type : Bullish
Timeframe : 1 hour
Bullish price crossover with adaptative moving average 50
Type : Bullish
Timeframe : 1 hour
Bullish price crossover with adaptative moving average 100
Type : Bullish
Timeframe : 1 hour
The probability of a further increase is high given the direction of the technical indicators.
Caution: the Central Indicators scanner currently detects an excess:
RSI indicator is overbought : over 70
Type : Neutral
Timeframe : 1 hour
CCI indicator is overbought : over 100
Type : Neutral
Timeframe : 1 hour
Williams %R indicator is overbought : over -20
Type : Neutral
Timeframe : 1 hour
Pivot points : price is over resistance 1
Type : Neutral
Timeframe : Weekly
Pivot points : price is over resistance 3
Type : Neutral
Timeframe : 1 hour
Aroon indicator bullish trend
Type : Bullish
Timeframe : 1 hour
Ichimoku : price is over the cloud
Type : Bullish
Timeframe : 1 hour
SuperTrend indicator bullish reversal
Type : Bullish
Timeframe : 1 hour
The Central Patterns scanner, which studies chart patterns, resistances and supports, has identified these signals:
Near horizontal resistance
Type : Bearish
Timeframe : 1 hour
Near support of triangle
Type : Bullish
Timeframe : 1 hour
From the Japanese candlestick perspective, the Central Candlesticks scanner notes the presence of these results that could impact the short-term trend:
Upside gap
Type : Bullish
Timeframe : 1 hour
Doji
Type : Neutral
Timeframe : 1 hour
Long white line
Type : Bullish
Timeframe : 1 hour
| S3 | S2 | S1 | Price | R1 | R2 | R3 | |
|---|---|---|---|---|---|---|---|
| ProTrendLines | 30.08 | 30.81 | 31.70 | 31.94 | 32.98 | 33.36 | 43.57 |
| Change (%) | -5.82% | -3.54% | -0.75% | - | +3.26% | +4.45% | +36.41% |
| Change | -1.86 | -1.13 | -0.24 | - | +1.04 | +1.42 | +11.63 |
| Level | Major | Minor | Intermediate | - | Minor | Major | Intermediate |
Pivot points can also be used to set your price objectives. Here is the price situation in relation to pivot points:
| Pivot points | S3 | S2 | S1 | PP | R1 | R2 | R3 |
|---|---|---|---|---|---|---|---|
| Standard | 29.13 | 29.35 | 29.71 | 29.93 | 30.29 | 30.51 | 30.87 |
| Camarilla | 29.90 | 29.95 | 30.01 | 30.06 | 30.11 | 30.17 | 30.22 |
| Woodie | 29.19 | 29.39 | 29.77 | 29.97 | 30.35 | 30.55 | 30.93 |
| Fibonacci | 29.35 | 29.58 | 29.71 | 29.93 | 30.16 | 30.29 | 30.51 |
| Pivot points | S3 | S2 | S1 | PP | R1 | R2 | R3 |
|---|---|---|---|---|---|---|---|
| Standard | 27.04 | 28.30 | 29.18 | 30.44 | 31.32 | 32.58 | 33.46 |
| Camarilla | 29.47 | 29.67 | 29.86 | 30.06 | 30.26 | 30.45 | 30.65 |
| Woodie | 26.85 | 28.21 | 28.99 | 30.35 | 31.13 | 32.49 | 33.27 |
| Fibonacci | 28.30 | 29.12 | 29.62 | 30.44 | 31.26 | 31.76 | 32.58 |
| Pivot points | S3 | S2 | S1 | PP | R1 | R2 | R3 |
|---|---|---|---|---|---|---|---|
| Standard | 24.23 | 26.41 | 28.61 | 30.79 | 32.99 | 35.17 | 37.37 |
| Camarilla | 29.60 | 30.00 | 30.40 | 30.80 | 31.20 | 31.60 | 32.01 |
| Woodie | 24.23 | 26.42 | 28.61 | 30.80 | 32.99 | 35.18 | 37.37 |
| Fibonacci | 26.41 | 28.09 | 29.12 | 30.79 | 32.47 | 33.50 | 35.17 |
Numerical data
The following are the details of the technical indicators and moving averages that were collected to generate this technical analysis:
| RSI (14): | 73.23 | |
| MACD (12,26,9): | -0.0800 | |
| Directional Movement: | 38.58 | |
| AROON (14): | 71.43 | |
| DEMA (21): | 30.11 | |
| Parabolic SAR (0,02-0,02-0,2): | 29.58 | |
| Elder Ray (13): | 1.59 | |
| Super Trend (3,10): | 30.44 | |
| Zig ZAG (10): | 31.94 | |
| VORTEX (21): | 0.9300 | |
| Stochastique (14,3,5): | 62.99 | |
| TEMA (21): | 30.14 | |
| Williams %R (14): | -19.85 | |
| Chande Momentum Oscillator (20): | 1.74 | |
| Repulse (5,40,3): | -0.0700 | |
| ROCnROLL: | 1 | |
| TRIX (15,9): | -0.1200 | |
| Courbe Coppock: | 0.87 |
| MA7: | 30.84 | |
| MA20: | 31.47 | |
| MA50: | 30.32 | |
| MA100: | 29.15 | |
| MAexp7: | 30.43 | |
| MAexp20: | 30.28 | |
| MAexp50: | 30.54 | |
| MAexp100: | 30.79 | |
| Price / MA7: | +3.57% | |
| Price / MA20: | +1.49% | |
| Price / MA50: | +5.34% | |
| Price / MA100: | +9.57% | |
| Price / MAexp7: | +4.96% | |
| Price / MAexp20: | +5.48% | |
| Price / MAexp50: | +4.58% | |
| Price / MAexp100: | +3.73% |
News
The latest news and videos published on CANCOM SE O.N. at the time of the analysis were as follows:
- EQS-News: Annual General Meeting of CANCOM SE elects Supervisory Board and approves dividend of € 1.00
- EQS-News: CANCOM: CANCOM Group starts the 2024 financial year with significant growth
- EQS-News: CANCOM SE: CANCOM publishes Annual Report 2023 and forecasts significant growth
- EQS-News: CANCOM SE: CANCOM grows very significantly in 2023 and achieves key forecast targets
- EQS-News: CANCOM SE: Supervisory Board of the CANCOM Group reorganized
About author
Online


Add a comment
Comments
0 comments on the analysis CANCOM SE O.N. - 1H