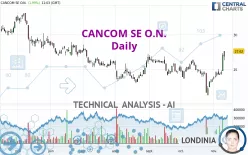
CANCOM SE O.N. - Daily - Technical analysis published on 11/10/2023 (GMT)
- 158
- 0
Click here for a new analysis!
- Timeframe : Daily
- - Analysis generated on
- Status : INVALID

Summary of the analysis

Additional analysis
Quotes
The CANCOM SE O.N. price is 27.62 EUR. The price has increased by +1.99% since the last closing and was traded between 26.32 EUR and 27.62 EUR over the period. The price is currently at +4.94% from its lowest and 0% from its highest.A bearish opening was detected by the Central Gaps scanner. Sellers are trying to impose a bearish trend in the very short term.
Bearish opening
Type : Bearish
Timeframe : Openning
Here is a more detailed summary of the historical variations registered by CANCOM SE O.N.:
New HIGH record (1 month)
Type : Bullish
Timeframe : Weekly
Technical
Technical analysis of this Daily chart of CANCOM SE O.N. indicates that the overall trend is slightly bullish. 60.71% of the signals given by moving averages are bullish. The overall trend could accelerate as strong bullish signals from short-term moving averages are expected. The Central Indicators scanner detects bullish signals on moving averages that could impact this trend:
Bullish trend reversal : Moving Average 20
Type : Bullish
Timeframe : Daily
Bullish trend reversal : Moving Average 50
Type : Bullish
Timeframe : Daily
Bullish trend reversal : adaptative moving average 50
Type : Bullish
Timeframe : Daily
Bullish trend reversal : adaptative moving average 100
Type : Bullish
Timeframe : Daily
In fact, 16 technical indicators on 18 studied are currently positioned bullish. Caution: the Central Indicators scanner currently detects an excess:
CCI indicator is overbought : over 100
Type : Neutral
Timeframe : Daily
Previous candle closed over Bollinger bands
Type : Neutral
Timeframe : Daily
Williams %R indicator is overbought : over -20
Type : Neutral
Timeframe : Daily
Pivot points : price is over resistance 3
Type : Neutral
Timeframe : Weekly
Central Patterns, the market scanner focusing on chart patterns, resistances and supports found this result:
Resistance of channel is broken
Type : Bullish
Timeframe : Daily
The Central Candlesticks scanner, specialised in Japanese candlesticks, did not identify any signals.
| S3 | S2 | S1 | Price | R1 | R2 | R3 | |
|---|---|---|---|---|---|---|---|
| ProTrendLines | 22.52 | 24.45 | 26.80 | 27.62 | 28.48 | 31.75 | 33.36 |
| Change (%) | -18.46% | -11.48% | -2.97% | - | +3.11% | +14.95% | +20.78% |
| Change | -5.10 | -3.17 | -0.82 | - | +0.86 | +4.13 | +5.74 |
| Level | Major | Minor | Major | - | Intermediate | Intermediate | Major |
Pivot points can also be used to set your price objectives. Here is the price situation in relation to pivot points:
| Pivot points | S3 | S2 | S1 | PP | R1 | R2 | R3 |
|---|---|---|---|---|---|---|---|
| Standard | 22.81 | 23.79 | 25.43 | 26.41 | 28.05 | 29.03 | 30.67 |
| Camarilla | 26.36 | 26.60 | 26.84 | 27.08 | 27.32 | 27.56 | 27.80 |
| Woodie | 23.15 | 23.96 | 25.77 | 26.58 | 28.39 | 29.20 | 31.01 |
| Fibonacci | 23.79 | 24.79 | 25.41 | 26.41 | 27.41 | 28.03 | 29.03 |
| Pivot points | S3 | S2 | S1 | PP | R1 | R2 | R3 |
|---|---|---|---|---|---|---|---|
| Standard | 21.89 | 22.47 | 23.49 | 24.07 | 25.09 | 25.67 | 26.69 |
| Camarilla | 24.06 | 24.21 | 24.35 | 24.50 | 24.65 | 24.79 | 24.94 |
| Woodie | 22.10 | 22.58 | 23.70 | 24.18 | 25.30 | 25.78 | 26.90 |
| Fibonacci | 22.47 | 23.09 | 23.46 | 24.07 | 24.69 | 25.06 | 25.67 |
| Pivot points | S3 | S2 | S1 | PP | R1 | R2 | R3 |
|---|---|---|---|---|---|---|---|
| Standard | 15.81 | 18.53 | 21.03 | 23.75 | 26.25 | 28.97 | 31.47 |
| Camarilla | 22.09 | 22.56 | 23.04 | 23.52 | 24.00 | 24.48 | 24.96 |
| Woodie | 15.69 | 18.48 | 20.91 | 23.70 | 26.13 | 28.92 | 31.35 |
| Fibonacci | 18.53 | 20.53 | 21.76 | 23.75 | 25.75 | 26.98 | 28.97 |
Numerical data
The following is the status of technical indicators and moving averages registered at the time this technical analysis was created:
| RSI (14): | 69.48 | |
| MACD (12,26,9): | 0.2800 | |
| Directional Movement: | 20.82 | |
| AROON (14): | 78.57 | |
| DEMA (21): | 24.93 | |
| Parabolic SAR (0,02-0,02-0,2): | 22.15 | |
| Elder Ray (13): | 1.98 | |
| Super Trend (3,10): | 24.02 | |
| Zig ZAG (10): | 27.46 | |
| VORTEX (21): | 1.0000 | |
| Stochastique (14,3,5): | 94.10 | |
| TEMA (21): | 25.42 | |
| Williams %R (14): | -0.64 | |
| Chande Momentum Oscillator (20): | 5.86 | |
| Repulse (5,40,3): | 11.4100 | |
| ROCnROLL: | 1 | |
| TRIX (15,9): | -0.1100 | |
| Courbe Coppock: | 9.46 |
| MA7: | 25.18 | |
| MA20: | 24.32 | |
| MA50: | 24.97 | |
| MA100: | 25.23 | |
| MAexp7: | 25.56 | |
| MAexp20: | 24.76 | |
| MAexp50: | 24.86 | |
| MAexp100: | 25.49 | |
| Price / MA7: | +9.69% | |
| Price / MA20: | +13.57% | |
| Price / MA50: | +10.61% | |
| Price / MA100: | +9.47% | |
| Price / MAexp7: | +8.06% | |
| Price / MAexp20: | +11.55% | |
| Price / MAexp50: | +11.10% | |
| Price / MAexp100: | +8.36% |
News
Don't forget to follow the news on CANCOM SE O.N.. At the time of publication of this analysis, the latest news was as follows:
- EQS-News: CANCOM SE: CANCOM Group grows in a difficult economic environment thanks to successful acquisition strategy
- EQS-News: CANCOM SE: Significant revenue and gross profit growth in the first half-year
- EQS-News: CANCOM: Jochen Borenich becomes Chief Sales Officer on the Executive Board of CANCOM SE
- EQS-Adhoc: CANCOM SE: One-off effects burden EBITDA and EBITA in the second quarter, revenue and gross profit development positive; Executive Board lowers 2023 full-year guidance.
- EQS-Adhoc: CANCOM SE: CANCOM SE decides to buy back shares
About author
Online


Add a comment
Comments
0 comments on the analysis CANCOM SE O.N. - Daily