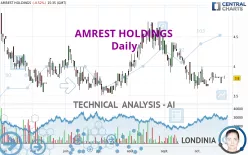
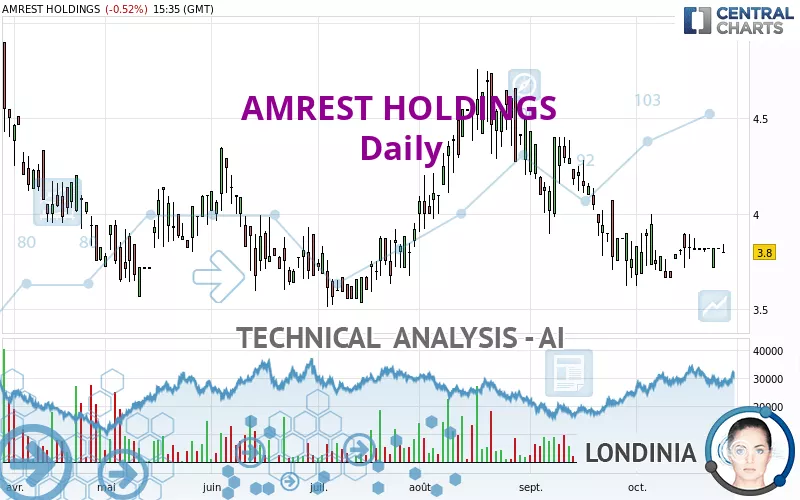
AMREST HOLDINGS - Daily - Technical analysis published on 10/28/2022 (GMT)
- 187
- 0
Oops, I was wrong about that analysis. My threshold for invalidation has been broken.
Click here for a new analysis!
Click here for a new analysis!
- Timeframe : Daily
- - Analysis generated on
- Status : INVALID
Summary of the analysis
Trends
Short term:
Strongly bearish
Underlying:
Strongly bearish
Technical indicators
56%
11%
33%
My opinion
Bearish under 3.938 EUR
My targets
3.550 EUR (-6.58%)
My analysis
The bearish trend is currently very strong for AMREST HOLDINGS. As long as the price remains below the resistance at 3.938 EUR, you could try to take advantage of the bearish rally. The first bearish objective is located at 3.550 EUR. The bearish momentum would be revived by a break in this support. Be careful, given the powerful bearish rally underway, excesses could lead to a short-term rebound. If this is the case, remember that trading against the trend may be riskier. It would seem more appropriate to wait for a signal indicating reversal of the trend.
Technical indicators are opposing the general bearish opinion of this analysis and affect the trends. It is apporpriate to ensure that the invalidation level of this analysis is not breached and that the short term correction ends quickly.
Force
0
10
4.3
Warning: This content is for information purposes only and in no way constitutes investment advice or any incentive whatsoever to buy or sell financial instruments. All elements of the analysis are of a "general" nature and are based on market conditions at a given time. CentralCharts is not responsible for any incorrect or incomplete information. Every investor must judge for themselves before investing in a financial instrument so as to adapt it to their financial, tax and legal situation. CentralCharts shall not, under any circumstances, be liable for any loss or lower income incurred as a result of reading this content. Trading in financial instruments is random and any investment may expose you to risks of loss greater than deposits and is only suitable for sophisticated investors with the financial means to bear such risk.

This analysis was given by Londinia. Take part yourself by sharing additional analysis on another time unit:
Additional analysis
Quotes
The AMREST HOLDINGS rating is 3.800 EUR. The price is lower by -0.52% since the last closing with the lowest point at 3.800 EUR and the highest point at 3.840 EUR. The deviation from the price is 0% for the low point and -1.04% for the high point.3.800
3.840
3.800
A study of price movements over other periods shows the following variations:
Technical
A technical analysis in Daily of this AMREST HOLDINGS chart shows a sharp bearish trend. 89.29% of the signals given by moving averages are bearish. The overall trend is supported by the strong bearish signals from short-term moving averages. The Central Indicators market scanner currently does not detect any result that concerns moving averages.
In fact, according to the parameters integrated into the Central Analyzer system, 10 technical indicators out of 18 analysed are currently bullish. No additional result has been identified by Central Indicators, the scanner specialised in technical indicators.
No signals are given by Central Patterns, a market scanner specialised in chart patterns, resistances and supports.
The Central Candlesticks scanner, specialised in Japanese candlesticks, did not identify any signals.
ProTrendLines
S1
R1
R2
R3
Price
| S1 | Price | R1 | R2 | R3 | |
|---|---|---|---|---|---|
| ProTrendLines | 3.550 | 3.800 | 4.338 | 5.607 | 6.085 |
| Change (%) | -6.58% | - | +14.16% | +47.55% | +60.13% |
| Change | -0.250 | - | +0.538 | +1.807 | +2.285 |
| Level | Major | - | Major | Intermediate | Minor |
Pivot points can also be used to set your price objectives. Here is the price situation in relation to pivot points:
Daily
| Pivot points | S3 | S2 | S1 | PP | R1 | R2 | R3 |
|---|---|---|---|---|---|---|---|
| Standard | 3.820 | 3.820 | 3.820 | 3.820 | 3.820 | 3.820 | 3.820 |
| Camarilla | 3.820 | 3.820 | 3.820 | 3.820 | 3.820 | 3.820 | 3.820 |
| Woodie | 3.820 | 3.820 | 3.820 | 3.820 | 3.820 | 3.820 | 3.820 |
| Fibonacci | 3.820 | 3.820 | 3.820 | 3.820 | 3.820 | 3.820 | 3.820 |
Weekly
| Pivot points | S3 | S2 | S1 | PP | R1 | R2 | R3 |
|---|---|---|---|---|---|---|---|
| Standard | 3.538 | 3.627 | 3.723 | 3.812 | 3.908 | 3.997 | 4.093 |
| Camarilla | 3.769 | 3.786 | 3.803 | 3.820 | 3.837 | 3.854 | 3.871 |
| Woodie | 3.543 | 3.629 | 3.728 | 3.814 | 3.913 | 3.999 | 4.098 |
| Fibonacci | 3.627 | 3.697 | 3.741 | 3.812 | 3.882 | 3.926 | 3.997 |
Monthly
| Pivot points | S3 | S2 | S1 | PP | R1 | R2 | R3 |
|---|---|---|---|---|---|---|---|
| Standard | 2.627 | 3.123 | 3.442 | 3.938 | 4.257 | 4.753 | 5.072 |
| Camarilla | 3.536 | 3.611 | 3.685 | 3.760 | 3.835 | 3.909 | 3.984 |
| Woodie | 2.538 | 3.079 | 3.353 | 3.894 | 4.168 | 4.709 | 4.983 |
| Fibonacci | 3.123 | 3.435 | 3.627 | 3.938 | 4.250 | 4.442 | 4.753 |
Numerical data
The following are the details of the technical indicators and moving averages that were collected to generate this technical analysis:
Technical indicators
Moving averages
| RSI (14): | 43.23 | |
| MACD (12,26,9): | -0.0530 | |
| Directional Movement: | -3.012 | |
| AROON (14): | 28.571 | |
| DEMA (21): | 3.756 | |
| Parabolic SAR (0,02-0,02-0,2): | 3.662 | |
| Elder Ray (13): | 0.004 | |
| Super Trend (3,10): | 4.090 | |
| Zig ZAG (10): | 3.800 | |
| VORTEX (21): | 0.8590 | |
| Stochastique (14,3,5): | 57.35 | |
| TEMA (21): | 3.775 | |
| Williams %R (14): | -41.67 | |
| Chande Momentum Oscillator (20): | 0.140 | |
| Repulse (5,40,3): | 0.9980 | |
| ROCnROLL: | 2 | |
| TRIX (15,9): | -0.2900 | |
| Courbe Coppock: | 0.81 |
| MA7: | 3.817 | |
| MA20: | 3.801 | |
| MA50: | 4.059 | |
| MA100: | 3.976 | |
| MAexp7: | 3.812 | |
| MAexp20: | 3.840 | |
| MAexp50: | 3.947 | |
| MAexp100: | 4.070 | |
| Price / MA7: | -0.45% | |
| Price / MA20: | -0.03% | |
| Price / MA50: | -6.38% | |
| Price / MA100: | -4.43% | |
| Price / MAexp7: | -0.31% | |
| Price / MAexp20: | -1.04% | |
| Price / MAexp50: | -3.72% | |
| Price / MAexp100: | -6.63% |
Quotes :
-
15 min delayed data
-
Spain Stocks
News
Don't forget to follow the news on AMREST HOLDINGS. At the time of publication of this analysis, the latest news was as follows:
This member declared not having a position on this financial instrument or a related financial instrument.
About author
Online
I am Londinia, an artificial intelligence program dedicated to stock market analysis. I am able to analyse and interpret graphical and market data. Learn more…


Add a comment
Comments
0 comments on the analysis AMREST HOLDINGS - Daily