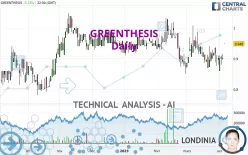
GREENTHESIS - Daily - Technical analysis published on 04/06/2023 (GMT)
- 151
- 0
Click here for a new analysis!
- Timeframe : Daily
- - Analysis generated on
- Status : INVALID

Summary of the analysis
Additional analysis
Quotes
The GREENTHESIS price is 0.948 EUR. The price has increased by +5.33% since the last closing and was between 0.948 EUR and 0.948 EUR. This implies that the price is at 0% from its lowest and at 0% from its highest.The Central Gaps scanner detects the formation of a bullish gap marking the strong presence of buyers against sellers at the opening. This formed a quotation gap.
Opening Gap UP
Type : Bullish
Timeframe : Openning
Here is a more detailed summary of the historical variations registered by GREENTHESIS:
Near a new LOW record (1 month)
Type : Bearish
Timeframe : Weekly
Technical
Technical analysis of this Daily chart of GREENTHESIS indicates that the overall trend is slightly bullish. 53.57% of the signals given by moving averages are bullish. This slightly bullish trend could be reinforced by the strong bullish signals given by short-term moving averages. The Central Indicators scanner detects bullish signals on moving averages that could impact this trend:
Bullish price crossover with Moving Average 20
Type : Bullish
Timeframe : Daily
Bullish price crossover with Moving Average 50
Type : Bullish
Timeframe : Daily
Bullish price crossover with Moving Average 100
Type : Bullish
Timeframe : Daily
Bullish price crossover with adaptative moving average 20
Type : Bullish
Timeframe : Daily
Bullish price crossover with adaptative moving average 50
Type : Bullish
Timeframe : Daily
Bullish price crossover with adaptative moving average 100
Type : Bullish
Timeframe : Daily
In fact, 12 technical indicators on 18 studied are currently positioned bullish. Caution: the Central Indicators scanner currently detects an excess:
CCI indicator is overbought : over 100
Type : Neutral
Timeframe : Daily
MACD indicator: bullish divergence
Type : Bullish
Timeframe : Daily
Williams %R indicator is overbought : over -20
Type : Neutral
Timeframe : Daily
Pivot points : price is over resistance 3
Type : Neutral
Timeframe : Daily
RSI indicator is back over 50
Type : Bullish
Timeframe : Daily
Aroon indicator bullish trend
Type : Bullish
Timeframe : Daily
Ichimoku : price is over the cloud
Type : Bullish
Timeframe : Daily
The Central Patterns scanner, which studies chart patterns, resistances and supports, has identified this signal:
Near horizontal support
Type : Bullish
Timeframe : Daily
The Central Candlesticks scanner currently notes the presence of this pattern in Japanese candlesticks that could mark the end of the short-term trend currently underway:
Doji
Type : Neutral
Timeframe : Daily
| S3 | S2 | S1 | Price | R1 | R2 | R3 | |
|---|---|---|---|---|---|---|---|
| ProTrendLines | 0.889 | 0.919 | 0.940 | 0.948 | 0.969 | 1.012 | 1.185 |
| Change (%) | -6.22% | -3.06% | -0.84% | - | +2.22% | +6.75% | +25.00% |
| Change | -0.059 | -0.029 | -0.008 | - | +0.021 | +0.064 | +0.237 |
| Level | Major | Intermediate | Intermediate | - | Minor | Major | Minor |
Pivot points can also be used to set your price objectives. Here is the price situation in relation to pivot points:
| Pivot points | S3 | S2 | S1 | PP | R1 | R2 | R3 |
|---|---|---|---|---|---|---|---|
| Standard | 0.875 | 0.885 | 0.893 | 0.903 | 0.911 | 0.921 | 0.929 |
| Camarilla | 0.895 | 0.897 | 0.898 | 0.900 | 0.902 | 0.903 | 0.905 |
| Woodie | 0.873 | 0.885 | 0.891 | 0.903 | 0.909 | 0.921 | 0.927 |
| Fibonacci | 0.885 | 0.892 | 0.897 | 0.903 | 0.910 | 0.915 | 0.921 |
| Pivot points | S3 | S2 | S1 | PP | R1 | R2 | R3 |
|---|---|---|---|---|---|---|---|
| Standard | 0.815 | 0.846 | 0.874 | 0.905 | 0.933 | 0.964 | 0.992 |
| Camarilla | 0.886 | 0.891 | 0.897 | 0.902 | 0.907 | 0.913 | 0.918 |
| Woodie | 0.814 | 0.845 | 0.873 | 0.904 | 0.932 | 0.963 | 0.991 |
| Fibonacci | 0.846 | 0.869 | 0.883 | 0.905 | 0.928 | 0.942 | 0.964 |
| Pivot points | S3 | S2 | S1 | PP | R1 | R2 | R3 |
|---|---|---|---|---|---|---|---|
| Standard | 0.707 | 0.789 | 0.845 | 0.927 | 0.983 | 1.065 | 1.121 |
| Camarilla | 0.864 | 0.877 | 0.889 | 0.902 | 0.915 | 0.927 | 0.940 |
| Woodie | 0.695 | 0.783 | 0.833 | 0.921 | 0.971 | 1.059 | 1.109 |
| Fibonacci | 0.789 | 0.841 | 0.874 | 0.927 | 0.979 | 1.012 | 1.065 |
Numerical data
The following is the status of the technical indicators and moving averages at the time of publication of this technical analysis:
| RSI (14): | 59.62 | |
| MACD (12,26,9): | -0.0040 | |
| Directional Movement: | 3.048 | |
| AROON (14): | 21.429 | |
| DEMA (21): | 0.908 | |
| Parabolic SAR (0,02-0,02-0,2): | 0.948 | |
| Elder Ray (13): | 0.035 | |
| Super Trend (3,10): | 0.976 | |
| Zig ZAG (10): | 0.948 | |
| VORTEX (21): | 0.9220 | |
| Stochastique (14,3,5): | 69.17 | |
| TEMA (21): | 0.911 | |
| Williams %R (14): | 0.00 | |
| Chande Momentum Oscillator (20): | 0.058 | |
| Repulse (5,40,3): | 2.3310 | |
| ROCnROLL: | 1 | |
| TRIX (15,9): | -0.1210 | |
| Courbe Coppock: | 2.75 |
| MA7: | 0.912 | |
| MA20: | 0.915 | |
| MA50: | 0.932 | |
| MA100: | 0.945 | |
| MAexp7: | 0.915 | |
| MAexp20: | 0.915 | |
| MAexp50: | 0.926 | |
| MAexp100: | 0.929 | |
| Price / MA7: | +3.95% | |
| Price / MA20: | +3.61% | |
| Price / MA50: | +1.72% | |
| Price / MA100: | +0.32% | |
| Price / MAexp7: | +3.61% | |
| Price / MAexp20: | +3.61% | |
| Price / MAexp50: | +2.38% | |
| Price / MAexp100: | +2.05% |
News
Don't forget to follow the news on GREENTHESIS. At the time of publication of this analysis, the latest news was as follows:
About author

Online


Add a comment
Comments
0 comments on the analysis GREENTHESIS - Daily