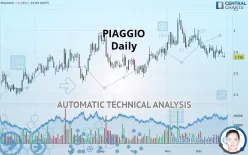
PIAGGIO - Daily - Technical analysis published on 01/02/2020 (GMT)
- 190
- 0
- Who voted?
Oops, I was wrong about that analysis. My threshold for invalidation has been broken.
Click here for a new analysis!
Click here for a new analysis!
- Timeframe : Daily
- - Analysis generated on
- Status : INVALID

Summary of the analysis
Trends
Court terme:
Strongly bearish
De fond:
Slightly bearish
Technical indicators
17%
50%
33%
My opinion
Bearish under 2.830 EUR
My targets
2.663 EUR (-3.09%)
2.399 EUR (-12.70%)
My analysis
PIAGGIO is currently trying to strengthen its basic trend with a very bearish short term. As long as the price remains below 2.830 EUR, traders may consider taking advantage of this bearish acceleration and setting themselves to trade only in short positions (for sale). Sellers will encounter the support at 2.663 EUR. A bearish break in this support would confirm a continuation of the bearish acceleration. The next support located at 2.399 EUR would then be the next bearish objective for sellers. Crossing it would then enable sellers to target 2.313 EUR. Beware of a possible return to above the resistance located at 2.830 EUR which would be a sign of a correction of the short-term bearish excesses registered.
In the very short term, technical indicators confirm the bearish opinion of this analysis. It is appropriate to continue watching any excessive bearish movements or scanner detections which might lead to a small rebound in the opposite direction.
FORCE
0
10
3.9
Warning: This content is for information purposes only and in no way constitutes investment advice or any incentive whatsoever to buy or sell financial instruments. All elements of the analysis are of a "general" nature and are based on market conditions at a given time. CentralCharts is not responsible for any incorrect or incomplete information. Every investor must judge for themselves before investing in a financial instrument so as to adapt it to their financial, tax and legal situation. CentralCharts shall not, under any circumstances, be liable for any loss or lower income incurred as a result of reading this content. Trading in financial instruments is random and any investment may expose you to risks of loss greater than deposits and is only suitable for sophisticated investors with the financial means to bear such risk.

This analysis was given by Vincent Launay. Take part yourself by sharing additional analysis on another time unit:
Additional analysis
Quotes
The PIAGGIO rating is 2.748 EUR. The price is lower by -0.36% since the last closing and was traded between 2.740 EUR and 2.794 EUR over the period. The price is currently at +0.29% from its lowest and -1.65% from its highest.2.740
2.794
2.748
A bearish gap was detected at the opening by the Central Gaps scanner. There are a lot of sellers and they have the upper hand in the very short term.
Opening Gap DOWN
Type : Bearish
Timeframe : Openning
Here is a more detailed summary of the historical variations registered by PIAGGIO:
Near a new HIGH record (1 month)
Type : Bullish
Timeframe : Weekly
Technical
Technical analysis of PIAGGIO in Daily shows an overall slightly bearish trend. 60.71% of the signals given by moving averages are bearish. This slightly bearish trend could be reinforced by the strong bearish signals given by short-term moving averages. The Central Indicators scanner does not detect any result on moving averages that would impact this trend.
In fact, only 9 technical indicators out of 18 studied are currently bearish. The Central Indicators scanner found this result concerning these indicators:
Pivot points : price is under support 1
Type : Neutral
Timeframe : Daily
An analysis of the price chart with the Central Patterns scanner (detector of chart patterns and resistances and supports) shows several results that can have an impact on the price change:
Near horizontal support
Type : Bullish
Timeframe : Daily
Near support of channel
Type : Bullish
Timeframe : Daily
The Central Candlesticks scanner which studies Japanese candlesticks did not detect anything.
ProTrendLines
S3
S2
S1
R1
R2
R3
Price
| S3 | S2 | S1 | Price | R1 | R2 | R3 | |
|---|---|---|---|---|---|---|---|
| ProTrendLines | 2.399 | 2.663 | 2.744 | 2.748 | 2.830 | 2.993 | 3.090 |
| Change (%) | -12.70% | -3.09% | -0.15% | - | +2.98% | +8.92% | +12.45% |
| Change | -0.349 | -0.085 | -0.004 | - | +0.082 | +0.245 | +0.342 |
| Level | Intermediate | Major | Major | - | Major | Major | Minor |
Pivot points can also be used to set your price objectives. Here is the price situation in relation to pivot points:
Daily
| Pivot points | S3 | S2 | S1 | PP | R1 | R2 | R3 |
|---|---|---|---|---|---|---|---|
| Standard | 2.695 | 2.739 | 2.763 | 2.807 | 2.831 | 2.875 | 2.899 |
| Camarilla | 2.767 | 2.774 | 2.780 | 2.786 | 2.792 | 2.799 | 2.805 |
| Woodie | 2.684 | 2.734 | 2.752 | 2.802 | 2.820 | 2.870 | 2.888 |
| Fibonacci | 2.739 | 2.765 | 2.781 | 2.807 | 2.833 | 2.849 | 2.875 |
Weekly
| Pivot points | S3 | S2 | S1 | PP | R1 | R2 | R3 |
|---|---|---|---|---|---|---|---|
| Standard | 2.605 | 2.665 | 2.739 | 2.799 | 2.873 | 2.933 | 3.007 |
| Camarilla | 2.775 | 2.787 | 2.800 | 2.812 | 2.824 | 2.837 | 2.849 |
| Woodie | 2.611 | 2.669 | 2.745 | 2.803 | 2.879 | 2.937 | 3.013 |
| Fibonacci | 2.665 | 2.717 | 2.748 | 2.799 | 2.851 | 2.882 | 2.933 |
Monthly
| Pivot points | S3 | S2 | S1 | PP | R1 | R2 | R3 |
|---|---|---|---|---|---|---|---|
| Standard | 2.418 | 2.614 | 2.772 | 2.968 | 3.126 | 3.322 | 3.480 |
| Camarilla | 2.833 | 2.865 | 2.898 | 2.930 | 2.963 | 2.995 | 3.027 |
| Woodie | 2.399 | 2.605 | 2.753 | 2.959 | 3.107 | 3.313 | 3.461 |
| Fibonacci | 2.614 | 2.749 | 2.833 | 2.968 | 3.103 | 3.187 | 3.322 |
Numerical data
The following are the details of the technical indicators and moving averages that were collected to generate this technical analysis:
Technical indicators
Moving averages
| RSI (14): | 41.24 | |
| MACD (12,26,9): | -0.0230 | |
| Directional Movement: | -4.141 | |
| AROON (14): | -64.286 | |
| DEMA (21): | 2.791 | |
| Parabolic SAR (0,02-0,02-0,2): | 2.734 | |
| Elder Ray (13): | -0.027 | |
| Super Trend (3,10): | 2.986 | |
| Zig ZAG (10): | 2.758 | |
| VORTEX (21): | 0.9110 | |
| Stochastique (14,3,5): | 32.07 | |
| TEMA (21): | 2.761 | |
| Williams %R (14): | -78.08 | |
| Chande Momentum Oscillator (20): | -0.058 | |
| Repulse (5,40,3): | -1.9490 | |
| ROCnROLL: | 2 | |
| TRIX (15,9): | -0.0970 | |
| Courbe Coppock: | 5.67 |
| MA7: | 2.784 | |
| MA20: | 2.828 | |
| MA50: | 2.849 | |
| MA100: | 2.781 | |
| MAexp7: | 2.788 | |
| MAexp20: | 2.817 | |
| MAexp50: | 2.820 | |
| MAexp100: | 2.766 | |
| Price / MA7: | -1.29% | |
| Price / MA20: | -2.83% | |
| Price / MA50: | -3.55% | |
| Price / MA100: | -1.19% | |
| Price / MAexp7: | -1.43% | |
| Price / MAexp20: | -2.45% | |
| Price / MAexp50: | -2.55% | |
| Price / MAexp100: | -0.65% |
News
The last news published on PIAGGIO at the time of the generation of this analysis was as follows:
- Piaggio Fast Forward Releases Limited Edition gita Robot with (RED)
- Piaggio Fast Forward Introduces the All New gita Robot
- Foton Motor and Piaggio Group signed an agreement for the development of light commercial vehicles
-
 Piaggio & C
-
Piaggio C
This member declared not having a position on this financial instrument or a related financial instrument.
About author

Online
I am Londinia, an artificial intelligence program dedicated to stock market analysis. I am able to analyse and interpret graphical and market data. Learn more…


Add a comment
Comments
0 comments on the analysis PIAGGIO - Daily