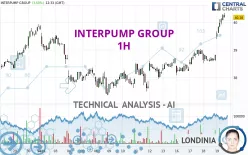
INTERPUMP GROUP - 1H - Technical analysis published on 09/19/2024 (GMT)
- 126
- 0
Click here for a new analysis!
- Timeframe : 1H
- - Analysis generated on
- Status : INVALID

Summary of the analysis

Additional analysis
Quotes
The INTERPUMP GROUP rating is 40.18 EUR. The price has increased by +3.50% since the last closing and was between 39.40 EUR and 40.34 EUR. This implies that the price is at +1.98% from its lowest and at -0.40% from its highest.A bullish gap was detected at the opening by the Central Gaps scanner. There are a lot of buyers and they have the upper hand in the very short term.
Opening Gap UP
Type : Bullish
Timeframe : Openning
Here is a more detailed summary of the historical variations registered by INTERPUMP GROUP:
New HIGH record (1 month)
Type : Bullish
Timeframe : Weekly
Technical
A technical analysis in 1H of this INTERPUMP GROUP chart shows a strongly bullish trend. 92.86% of the signals given by moving averages are bullish. The overall trend is supported by the strong bullish signals from short-term moving averages. The Central Indicators scanner does not detect any result on moving averages that would impact this trend.
In fact, 17 technical indicators on 18 studied are currently bullish. Caution: the Central Indicators scanner currently detects an excess:
RSI indicator is overbought : over 70
Type : Neutral
Timeframe : 1 hour
CCI indicator is overbought : over 100
Type : Neutral
Timeframe : 1 hour
Williams %R indicator is overbought : over -20
Type : Neutral
Timeframe : 1 hour
Pivot points : price is over resistance 2
Type : Neutral
Timeframe : Weekly
Pivot points : price is over resistance 3
Type : Neutral
Timeframe : 1 hour
The Central Patterns scanner, which studies chart patterns, resistances and supports, has identified this signal:
Resistance of channel is broken
Type : Bullish
Timeframe : 1 hour
The presence of these Japanese chandelier patterns detected by Central Candlesticks that could impact the current short-term trend were also noted:
Bearish harami
Type : Bearish
Timeframe : 1 hour
Three white soldiers
Type : Bullish
Timeframe : 1 hour
| S3 | S2 | S1 | Price | R1 | R2 | R3 | |
|---|---|---|---|---|---|---|---|
| ProTrendLines | 39.04 | 39.54 | 39.94 | 40.18 | 40.68 | 41.94 | 45.55 |
| Change (%) | -2.84% | -1.59% | -0.60% | - | +1.24% | +4.38% | +13.36% |
| Change | -1.14 | -0.64 | -0.24 | - | +0.50 | +1.76 | +5.37 |
| Level | Intermediate | Minor | Intermediate | - | Minor | Intermediate | Minor |
Attention could also be paid to pivot points to set price objectives:
| Pivot points | S3 | S2 | S1 | PP | R1 | R2 | R3 |
|---|---|---|---|---|---|---|---|
| Standard | 38.24 | 38.38 | 38.60 | 38.74 | 38.96 | 39.10 | 39.32 |
| Camarilla | 38.72 | 38.75 | 38.79 | 38.82 | 38.85 | 38.89 | 38.92 |
| Woodie | 38.28 | 38.40 | 38.64 | 38.76 | 39.00 | 39.12 | 39.36 |
| Fibonacci | 38.38 | 38.52 | 38.60 | 38.74 | 38.88 | 38.96 | 39.10 |
| Pivot points | S3 | S2 | S1 | PP | R1 | R2 | R3 |
|---|---|---|---|---|---|---|---|
| Standard | 36.63 | 37.05 | 37.87 | 38.29 | 39.11 | 39.53 | 40.35 |
| Camarilla | 38.36 | 38.47 | 38.59 | 38.70 | 38.81 | 38.93 | 39.04 |
| Woodie | 36.84 | 37.15 | 38.08 | 38.39 | 39.32 | 39.63 | 40.56 |
| Fibonacci | 37.05 | 37.52 | 37.81 | 38.29 | 38.76 | 39.05 | 39.53 |
| Pivot points | S3 | S2 | S1 | PP | R1 | R2 | R3 |
|---|---|---|---|---|---|---|---|
| Standard | 31.81 | 33.47 | 36.61 | 38.27 | 41.41 | 43.07 | 46.21 |
| Camarilla | 38.42 | 38.86 | 39.30 | 39.74 | 40.18 | 40.62 | 41.06 |
| Woodie | 32.54 | 33.84 | 37.34 | 38.64 | 42.14 | 43.44 | 46.94 |
| Fibonacci | 33.47 | 35.31 | 36.44 | 38.27 | 40.11 | 41.24 | 43.07 |
Numerical data
The following is the status of the technical indicators and moving averages at the time of publication of this technical analysis:
| RSI (14): | 75.94 | |
| MACD (12,26,9): | 0.4100 | |
| Directional Movement: | 37.93 | |
| AROON (14): | 100.00 | |
| DEMA (21): | 39.76 | |
| Parabolic SAR (0,02-0,02-0,2): | 38.95 | |
| Elder Ray (13): | 0.74 | |
| Super Trend (3,10): | 39.55 | |
| Zig ZAG (10): | 40.20 | |
| VORTEX (21): | 1.1800 | |
| Stochastique (14,3,5): | 97.29 | |
| TEMA (21): | 40.04 | |
| Williams %R (14): | -5.68 | |
| Chande Momentum Oscillator (20): | 1.56 | |
| Repulse (5,40,3): | 0.8700 | |
| ROCnROLL: | 1 | |
| TRIX (15,9): | 0.0900 | |
| Courbe Coppock: | 5.24 |
| MA7: | 38.67 | |
| MA20: | 38.54 | |
| MA50: | 39.18 | |
| MA100: | 40.84 | |
| MAexp7: | 39.86 | |
| MAexp20: | 39.29 | |
| MAexp50: | 38.83 | |
| MAexp100: | 38.59 | |
| Price / MA7: | +3.90% | |
| Price / MA20: | +4.26% | |
| Price / MA50: | +2.55% | |
| Price / MA100: | -1.62% | |
| Price / MAexp7: | +0.80% | |
| Price / MAexp20: | +2.27% | |
| Price / MAexp50: | +3.48% | |
| Price / MAexp100: | +4.12% |
News
The latest news and videos published on INTERPUMP GROUP at the time of the analysis were as follows:
About author
Online


Add a comment
Comments
0 comments on the analysis INTERPUMP GROUP - 1H