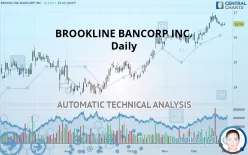
BROOKLINE BANCORP INC. - Daily - Technical analysis published on 12/31/2019 (GMT)
- 226
- 0
- Who voted?
Click here for a new analysis!
- Timeframe : Daily
- - Analysis generated on
- Status : INVALID

Summary of the analysis

Additional analysis
Quotes
The BROOKLINE BANCORP INC. price is 16.53 USD. On the day, this instrument gained +0.12% and was between 16.48 USD and 16.57 USD. This implies that the price is at +0.30% from its lowest and at -0.24% from its highest.The Central Gaps scanner detects a bearish opening. A small advantage for sellers in the very short term.
Bearish opening
Type : Bearish
Timeframe : Openning
Here is a more detailed summary of the historical variations registered by BROOKLINE BANCORP INC.:
Near a new HIGH record (1 year)
Type : Bullish
Timeframe : Weekly
Near a new HIGH record (1st january)
Type : Bullish
Timeframe : Weekly
Near a new HIGH record (1 month)
Type : Bullish
Timeframe : Weekly
Technical
Technical analysis of BROOKLINE BANCORP INC. in Daily shows a strongly overall bullish trend. 92.86% of the signals given by moving averages are bullish. This strongly bullish trend is supported by the strong bullish signals given by short-term moving averages. The Central Indicators market scanner currently does not detect any result that concerns moving averages.
The technical indicators are generally neutral. They do not provide relevant information on the direction of future price movements.
Central Indicators, the detector scanner for these technical indicators has recently detected several signals:
Parabolic SAR indicator bearish reversal
Type : Bearish
Timeframe : Daily
Price is back under the pivot point
Type : Bearish
Timeframe : Weekly
Central Patterns, the market scanner focusing on chart patterns, resistances and supports found this result:
Near support of channel
Type : Bullish
Timeframe : Daily
From the Japanese candlestick perspective, the Central Candlesticks scanner notes the presence of these results that could impact the short-term trend:
Bullish harami
Type : Bullish
Timeframe : Daily
Doji
Type : Neutral
Timeframe : Daily
| S3 | S2 | S1 | Price | R1 | R2 | R3 | |
|---|---|---|---|---|---|---|---|
| ProTrendLines | 14.35 | 15.03 | 16.11 | 16.53 | 16.59 | 16.83 | 17.70 |
| Change (%) | -13.19% | -9.07% | -2.54% | - | +0.36% | +1.81% | +7.08% |
| Change | -2.18 | -1.50 | -0.42 | - | +0.06 | +0.30 | +1.17 |
| Level | Intermediate | Minor | Intermediate | - | Major | Intermediate | Minor |
To determine price objectives, it is also possible to use the pivot points. Here is the price position in relation to pivot points:
| Pivot points | S3 | S2 | S1 | PP | R1 | R2 | R3 |
|---|---|---|---|---|---|---|---|
| Standard | 16.21 | 16.31 | 16.41 | 16.51 | 16.61 | 16.71 | 16.81 |
| Camarilla | 16.46 | 16.47 | 16.49 | 16.51 | 16.53 | 16.55 | 16.57 |
| Woodie | 16.21 | 16.31 | 16.41 | 16.51 | 16.61 | 16.71 | 16.81 |
| Fibonacci | 16.31 | 16.39 | 16.43 | 16.51 | 16.59 | 16.63 | 16.71 |
| Pivot points | S3 | S2 | S1 | PP | R1 | R2 | R3 |
|---|---|---|---|---|---|---|---|
| Standard | 15.97 | 16.20 | 16.33 | 16.56 | 16.69 | 16.92 | 17.05 |
| Camarilla | 16.36 | 16.39 | 16.43 | 16.46 | 16.49 | 16.53 | 16.56 |
| Woodie | 15.92 | 16.18 | 16.28 | 16.54 | 16.64 | 16.90 | 17.00 |
| Fibonacci | 16.20 | 16.34 | 16.42 | 16.56 | 16.70 | 16.78 | 16.92 |
| Pivot points | S3 | S2 | S1 | PP | R1 | R2 | R3 |
|---|---|---|---|---|---|---|---|
| Standard | 15.15 | 15.38 | 15.72 | 15.95 | 16.28 | 16.51 | 16.85 |
| Camarilla | 15.90 | 15.95 | 16.00 | 16.05 | 16.10 | 16.15 | 16.21 |
| Woodie | 15.20 | 15.41 | 15.77 | 15.97 | 16.33 | 16.54 | 16.90 |
| Fibonacci | 15.38 | 15.60 | 15.73 | 15.95 | 16.16 | 16.29 | 16.51 |
Numerical data
The following are the details of the technical indicators and moving averages that were collected to generate this technical analysis:
| RSI (14): | 57.91 | |
| MACD (12,26,9): | 0.1800 | |
| Directional Movement: | 10.50 | |
| AROON (14): | 35.72 | |
| DEMA (21): | 16.65 | |
| Parabolic SAR (0,02-0,02-0,2): | 16.95 | |
| Elder Ray (13): | 0.03 | |
| Super Trend (3,10): | 16.03 | |
| Zig ZAG (10): | 16.51 | |
| VORTEX (21): | 1.0200 | |
| Stochastique (14,3,5): | 53.37 | |
| TEMA (21): | 16.65 | |
| Williams %R (14): | -43.96 | |
| Chande Momentum Oscillator (20): | 0.19 | |
| Repulse (5,40,3): | 0.2200 | |
| ROCnROLL: | 1 | |
| TRIX (15,9): | 0.1800 | |
| Courbe Coppock: | 6.47 |
| MA7: | 16.57 | |
| MA20: | 16.37 | |
| MA50: | 16.08 | |
| MA100: | 15.23 | |
| MAexp7: | 16.54 | |
| MAexp20: | 16.40 | |
| MAexp50: | 16.01 | |
| MAexp100: | 15.58 | |
| Price / MA7: | -0.24% | |
| Price / MA20: | +0.98% | |
| Price / MA50: | +2.80% | |
| Price / MA100: | +8.54% | |
| Price / MAexp7: | -0.06% | |
| Price / MAexp20: | +0.79% | |
| Price / MAexp50: | +3.25% | |
| Price / MAexp100: | +6.10% |
News
The last news published on BROOKLINE BANCORP INC. at the time of the generation of this analysis was as follows:
- Brookline Bancorp, Inc. Announces Approval of Stock Repurchase Program
- Brookline Bancorp Announces Third Quarter Results
- Brookline Bancorp, Inc. Announces Third Quarter 2019 Earnings Release Date and Conference Call
- Brookline Bancorp Announces Second Quarter Results Net Income of $20.5 million, EPS of $0.26
- Brookline Bancorp, Inc. Announces Second Quarter 2019 Earnings Release Date and Conference Call
About author

Online


Add a comment
Comments
0 comments on the analysis BROOKLINE BANCORP INC. - Daily