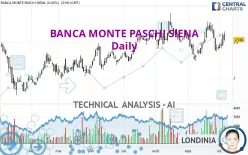
BANCA MONTE PASCHI SIENA - Daily - Technical analysis published on 10/06/2023 (GMT)
- 144
- 0
Click here for a new analysis!
- Timeframe : Daily
- - Analysis generated on
- Status : INVALID

Summary of the analysis

Additional analysis
Quotes
BANCA MONTE PASCHI SIENA rating 2.612 EUR. The price registered an increase of +3.00% on the session and was between 2.530 EUR and 2.629 EUR. This implies that the price is at +3.24% from its lowest and at -0.65% from its highest.A bullish opening was detected by the Central Gaps scanner. Buyers are trying to impose a bullish momentum in the very short term.
Bullish opening
Type : Bullish
Timeframe : Openning
Here is a more detailed summary of the historical variations registered by BANCA MONTE PASCHI SIENA:
Technical
A technical analysis in Daily of this BANCA MONTE PASCHI SIENA chart shows a strongly bullish trend. 89.29% of the signals given by moving averages are bullish. This strongly bullish trend is supported by the strong bullish signals given by short-term moving averages. The Central Indicators scanner detects a bullish signal on moving averages that could impact this trend:
Bullish price crossover with Moving Average 50
Type : Bullish
Timeframe : Daily
In fact, according to the parameters integrated into the Central Analyzer system, 11 technical indicators out of 18 analysed are currently bullish. Central Indicators, the detector scanner for these technical indicators has recently detected several signals:
MACD crosses UP its Moving Average
Type : Bullish
Timeframe : Daily
MACD indicator is back over 0
Type : Bullish
Timeframe : Daily
Price is back over the pivot point
Type : Bullish
Timeframe : Daily
Price is back over the pivot point
Type : Bullish
Timeframe : Weekly
Williams %R indicator is back over -50
Type : Bullish
Timeframe : Daily
The Central Patterns scanner, which studies chart patterns, resistances and supports, has identified these signals:
Near horizontal resistance
Type : Bearish
Timeframe : Daily
Near resistance of channel
Type : Bearish
Timeframe : Daily
For a small rebound in the very short term, the Central Candlesticks scanner currently notes the presence of this bullish pattern in Japanese candlesticks:
Bullish harami
Type : Bullish
Timeframe : Daily
| S3 | S2 | S1 | Price | R1 | R2 | R3 | |
|---|---|---|---|---|---|---|---|
| ProTrendLines | 1.993 | 2.317 | 2.436 | 2.612 | 2.628 | 2.740 | 2.850 |
| Change (%) | -23.70% | -11.29% | -6.74% | - | +0.61% | +4.90% | +9.11% |
| Change | -0.619 | -0.295 | -0.176 | - | +0.016 | +0.128 | +0.238 |
| Level | Minor | Intermediate | Major | - | Intermediate | Major | Intermediate |
To determine price objectives, it is also possible to use the pivot points. Here is the price position in relation to pivot points:
| Pivot points | S3 | S2 | S1 | PP | R1 | R2 | R3 |
|---|---|---|---|---|---|---|---|
| Standard | 2.342 | 2.427 | 2.481 | 2.566 | 2.620 | 2.705 | 2.759 |
| Camarilla | 2.498 | 2.511 | 2.523 | 2.536 | 2.549 | 2.562 | 2.574 |
| Woodie | 2.328 | 2.419 | 2.467 | 2.558 | 2.606 | 2.697 | 2.745 |
| Fibonacci | 2.427 | 2.480 | 2.513 | 2.566 | 2.619 | 2.652 | 2.705 |
| Pivot points | S3 | S2 | S1 | PP | R1 | R2 | R3 |
|---|---|---|---|---|---|---|---|
| Standard | 1.880 | 2.122 | 2.268 | 2.510 | 2.656 | 2.898 | 3.044 |
| Camarilla | 2.308 | 2.344 | 2.379 | 2.415 | 2.451 | 2.486 | 2.522 |
| Woodie | 1.833 | 2.098 | 2.221 | 2.486 | 2.609 | 2.874 | 2.997 |
| Fibonacci | 2.122 | 2.270 | 2.362 | 2.510 | 2.658 | 2.750 | 2.898 |
| Pivot points | S3 | S2 | S1 | PP | R1 | R2 | R3 |
|---|---|---|---|---|---|---|---|
| Standard | 1.610 | 1.921 | 2.168 | 2.479 | 2.726 | 3.037 | 3.284 |
| Camarilla | 2.262 | 2.313 | 2.364 | 2.415 | 2.466 | 2.517 | 2.569 |
| Woodie | 1.578 | 1.905 | 2.136 | 2.463 | 2.694 | 3.021 | 3.252 |
| Fibonacci | 1.921 | 2.134 | 2.266 | 2.479 | 2.692 | 2.824 | 3.037 |
Numerical data
The following are the details of the technical indicators and moving averages that were collected to generate this technical analysis:
| RSI (14): | 55.29 | |
| MACD (12,26,9): | 0.0060 | |
| Directional Movement: | 5.703 | |
| AROON (14): | -42.857 | |
| DEMA (21): | 2.535 | |
| Parabolic SAR (0,02-0,02-0,2): | 2.691 | |
| Elder Ray (13): | 0.047 | |
| Super Trend (3,10): | 2.771 | |
| Zig ZAG (10): | 2.611 | |
| VORTEX (21): | 1.0950 | |
| Stochastique (14,3,5): | 50.82 | |
| TEMA (21): | 2.537 | |
| Williams %R (14): | -40.28 | |
| Chande Momentum Oscillator (20): | -0.117 | |
| Repulse (5,40,3): | 2.4490 | |
| ROCnROLL: | 1 | |
| TRIX (15,9): | 0.0060 | |
| Courbe Coppock: | 0.96 |
| MA7: | 2.500 | |
| MA20: | 2.530 | |
| MA50: | 2.543 | |
| MA100: | 2.431 | |
| MAexp7: | 2.541 | |
| MAexp20: | 2.529 | |
| MAexp50: | 2.508 | |
| MAexp100: | 2.441 | |
| Price / MA7: | +4.48% | |
| Price / MA20: | +3.24% | |
| Price / MA50: | +2.71% | |
| Price / MA100: | +7.45% | |
| Price / MAexp7: | +2.79% | |
| Price / MAexp20: | +3.28% | |
| Price / MAexp50: | +4.15% | |
| Price / MAexp100: | +7.01% |
News
Don't forget to follow the news on BANCA MONTE PASCHI SIENA. At the time of publication of this analysis, the latest news was as follows:
-
 The moment the lights went out on MPs - BBC News
-
MPs demand answers over rising cost of F-35 jets
-
Brits & MPs disagree with May's #Brexit approach
-
Cross-party group of MPs to fight 'destructive' hard #Brexit
-
Monte dei Paschi to cut 5,500 jobs in EU-approved restructuring plan
About author
Online


Add a comment
Comments
0 comments on the analysis BANCA MONTE PASCHI SIENA - Daily