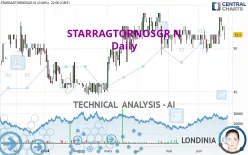
STARRAGTORNOSGR N - Daily - Technical analysis published on 06/27/2024 (GMT)
- 131
- 0
Click here for a new analysis!
- Timeframe : Daily
- - Analysis generated on
- Status : INVALID

Summary of the analysis

Additional analysis
Quotes
The STARRAGTORNOSGR N rating is 54.0 CHF. The price registered an increase of +4.85% on the session with the lowest point at 52.5 CHF and the highest point at 54.5 CHF. The deviation from the price is +2.86% for the low point and -0.92% for the high point.The Central Gaps scanner detects a bullish opening. A small advantage for buyers in the very short term.
Bullish opening
Type : Bullish
Timeframe : Openning
Here is a more detailed summary of the historical variations registered by STARRAGTORNOSGR N:
New HIGH record (1st january)
Type : Bullish
Timeframe : Weekly
New HIGH record (1 month)
Type : Bullish
Timeframe : Weekly
The Central Volumes scanner detects abnormal volumes on the asset:
Abnormal volumes
Timeframe : 5 days
Abnormal volumes
Timeframe : 20 days
Technical
A technical analysis in Daily of this STARRAGTORNOSGR N chart shows a strongly bullish trend. 89.29% of the signals given by moving averages are bullish. The overall trend is supported by the strong bullish signals from short-term moving averages. The Central Indicators market scanner is currently detecting a bullish signal that could impact this trend:
Bullish price crossover with Moving Average 50
Type : Bullish
Timeframe : Daily
In fact, 14 technical indicators on 18 studied are currently positioned bullish. But beware of excesses. The Central Indicators scanner currently detects this:
CCI indicator is overbought : over 100
Type : Neutral
Timeframe : Daily
Williams %R indicator is overbought : over -20
Type : Neutral
Timeframe : Daily
Pivot points : price is over resistance 3
Type : Neutral
Timeframe : Daily
Ichimoku : price is over the cloud
Type : Bullish
Timeframe : Daily
An analysis of the price chart with the Central Patterns scanner (detector of chart patterns and resistances and supports) shows several results that can have an impact on the price change:
Horizontal resistance is broken
Type : Bullish
Timeframe : Daily
Resistance of channel is broken
Type : Bullish
Timeframe : Daily
Resistance of triangle is broken
Type : Bullish
Timeframe : Daily
The Central Candlesticks scanner, specialised in Japanese candlesticks, did not identify any signals.
| S3 | S2 | S1 | Price | R1 | R2 | R3 | |
|---|---|---|---|---|---|---|---|
| ProTrendLines | 50.0 | 52.0 | 53.0 | 54.0 | 54.7 | 61.0 | 425.0 |
| Change (%) | -7.41% | -3.70% | -1.85% | - | +1.30% | +12.96% | +687.04% |
| Change | -4.0 | -2.0 | -1.0 | - | +0.7 | +7.0 | +371.0 |
| Level | Intermediate | Major | Minor | - | Major | Intermediate | Minor |
Pivot points can also be used to set your price objectives. Here is the price situation in relation to pivot points:
| Pivot points | S3 | S2 | S1 | PP | R1 | R2 | R3 |
|---|---|---|---|---|---|---|---|
| Standard | 49.3 | 50.2 | 50.8 | 51.7 | 52.3 | 53.2 | 53.8 |
| Camarilla | 51.1 | 51.2 | 51.4 | 51.5 | 51.6 | 51.8 | 51.9 |
| Woodie | 49.3 | 50.1 | 50.8 | 51.6 | 52.3 | 53.1 | 53.8 |
| Fibonacci | 50.2 | 50.7 | 51.1 | 51.7 | 52.2 | 52.6 | 53.2 |
| Pivot points | S3 | S2 | S1 | PP | R1 | R2 | R3 |
|---|---|---|---|---|---|---|---|
| Standard | 48.5 | 49.5 | 51.5 | 52.5 | 54.5 | 55.5 | 57.5 |
| Camarilla | 52.7 | 53.0 | 53.2 | 53.5 | 53.8 | 54.1 | 54.3 |
| Woodie | 49.0 | 49.8 | 52.0 | 52.8 | 55.0 | 55.8 | 58.0 |
| Fibonacci | 49.5 | 50.7 | 51.4 | 52.5 | 53.7 | 54.4 | 55.5 |
| Pivot points | S3 | S2 | S1 | PP | R1 | R2 | R3 |
|---|---|---|---|---|---|---|---|
| Standard | 46.7 | 48.1 | 49.6 | 51.0 | 52.5 | 53.9 | 55.4 |
| Camarilla | 50.2 | 50.5 | 50.7 | 51.0 | 51.3 | 51.5 | 51.8 |
| Woodie | 46.7 | 48.1 | 49.6 | 51.0 | 52.5 | 53.9 | 55.4 |
| Fibonacci | 48.1 | 49.2 | 49.9 | 51.0 | 52.1 | 52.8 | 53.9 |
Numerical data
The following is the status of technical indicators and moving averages registered at the time this technical analysis was created:
| RSI (14): | 61.10 | |
| MACD (12,26,9): | 0.4000 | |
| Directional Movement: | 5.9 | |
| AROON (14): | 92.9 | |
| DEMA (21): | 52.1 | |
| Parabolic SAR (0,02-0,02-0,2): | 50.3 | |
| Elder Ray (13): | 1.5 | |
| Super Trend (3,10): | 49.5 | |
| Zig ZAG (10): | 54.0 | |
| VORTEX (21): | 1.0000 | |
| Stochastique (14,3,5): | 72.30 | |
| TEMA (21): | 52.5 | |
| Williams %R (14): | -9.80 | |
| Chande Momentum Oscillator (20): | 4.0 | |
| Repulse (5,40,3): | 3.9000 | |
| ROCnROLL: | 1 | |
| TRIX (15,9): | 0.0000 | |
| Courbe Coppock: | 6.50 |
| MA7: | 52.4 | |
| MA20: | 51.3 | |
| MA50: | 51.6 | |
| MA100: | 50.3 | |
| MAexp7: | 52.4 | |
| MAexp20: | 51.7 | |
| MAexp50: | 51.4 | |
| MAexp100: | 50.9 | |
| Price / MA7: | +3.05% | |
| Price / MA20: | +5.26% | |
| Price / MA50: | +4.65% | |
| Price / MA100: | +7.36% | |
| Price / MAexp7: | +3.05% | |
| Price / MAexp20: | +4.45% | |
| Price / MAexp50: | +5.06% | |
| Price / MAexp100: | +6.09% |
News
Don't forget to follow the news on STARRAGTORNOSGR N. At the time of publication of this analysis, the latest news was as follows:
- K&B Chip Into Semi-Conductor Industry With Starrag
- Starrag & Haimer to Sponsor STEM Golf Event
- Aerospace and EV Segment Gets a Boost With New Starrag Machine Tool
- Starrag's New Bumotec Machine Picks Through the Bones of Complex Manufacturing
-
 Starrag Group Holding
About author
Online


Add a comment
Comments
0 comments on the analysis STARRAGTORNOSGR N - Daily