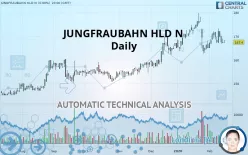
JUNGFRAUBAHN HLD N - Daily - Technical analysis published on 02/19/2020 (GMT)
- 316
- 0
- Who voted?
Click here for a new analysis!
- Timeframe : Daily
- - Analysis generated on
- Status : INVALID

Summary of the analysis

Additional analysis
Quotes
The JUNGFRAUBAHN HLD N price is 167.40 CHF. On the day, this instrument lost +0.00% and was traded between 167.20 CHF and 168.40 CHF over the period. The price is currently at +0.12% from its lowest and -0.59% from its highest.The Central Gaps scanner detects a bearish opening. A small advantage for sellers in the very short term.
Bearish opening
Type : Bearish
Timeframe : Openning
A study of price movements over other periods shows the following variations:
Near a new HIGH record (5 years)
Type : Bullish
Timeframe : Weekly
Near a new LOW record (1st january)
Type : Bearish
Timeframe : Weekly
Near a new LOW record (1 month)
Type : Bearish
Timeframe : Weekly
Technical
Technical analysis of this Daily chart of JUNGFRAUBAHN HLD N indicates that the overall trend is bullish. 71.43% of the signals given by moving averages are bullish. Caution: the neutral signals currently given by short-term moving averages show us that the global trend is losing momentum. The Central Indicators scanner detects bearish signals on moving averages that could impact this trend:
Bearish trend reversal : adaptative moving average 20
Type : Bearish
Timeframe : Daily
Bearish price crossover with adaptative moving average 50
Type : Bearish
Timeframe : Daily
An assessment of technical indicators does not currently provide any relevant information on the direction of future price movements.
Central Indicators, the scanner specialised in technical indicators, has identified these signals:
RSI indicator is back under 50
Type : Bearish
Timeframe : Daily
Price is back over the pivot point
Type : Bullish
Timeframe : Weekly
Price is back under the pivot point
Type : Bearish
Timeframe : Daily
Central Patterns, the scanner specializing in chart patterns, did not identify any signals.
No result was found by the Central Candlesticks scanner on Japanese candlesticks.
| S3 | S2 | S1 | Price | R1 | R2 | R3 | |
|---|---|---|---|---|---|---|---|
| ProTrendLines | 139.44 | 150.71 | 159.85 | 167.40 | 167.50 | 172.00 | 176.20 |
| Change (%) | -16.70% | -9.97% | -4.51% | - | +0.06% | +2.75% | +5.26% |
| Change | -27.96 | -16.69 | -7.55 | - | +0.10 | +4.60 | +8.80 |
| Level | Major | Major | Major | - | Major | Minor | Major |
Pivot points can also be used to set your price objectives. Here is the price situation in relation to pivot points:
| Pivot points | S3 | S2 | S1 | PP | R1 | R2 | R3 |
|---|---|---|---|---|---|---|---|
| Standard | 162.93 | 164.87 | 166.13 | 168.07 | 169.33 | 171.27 | 172.53 |
| Camarilla | 166.52 | 166.81 | 167.11 | 167.40 | 167.69 | 167.99 | 168.28 |
| Woodie | 162.60 | 164.70 | 165.80 | 167.90 | 169.00 | 171.10 | 172.20 |
| Fibonacci | 164.87 | 166.09 | 166.84 | 168.07 | 169.29 | 170.04 | 171.27 |
| Pivot points | S3 | S2 | S1 | PP | R1 | R2 | R3 |
|---|---|---|---|---|---|---|---|
| Standard | 158.87 | 161.93 | 165.87 | 168.93 | 172.87 | 175.93 | 179.87 |
| Camarilla | 167.88 | 168.52 | 169.16 | 169.80 | 170.44 | 171.08 | 171.73 |
| Woodie | 159.30 | 162.15 | 166.30 | 169.15 | 173.30 | 176.15 | 180.30 |
| Fibonacci | 161.93 | 164.61 | 166.26 | 168.93 | 171.61 | 173.26 | 175.93 |
| Pivot points | S3 | S2 | S1 | PP | R1 | R2 | R3 |
|---|---|---|---|---|---|---|---|
| Standard | 141.27 | 151.93 | 158.47 | 169.13 | 175.67 | 186.33 | 192.87 |
| Camarilla | 160.27 | 161.85 | 163.42 | 165.00 | 166.58 | 168.15 | 169.73 |
| Woodie | 139.20 | 150.90 | 156.40 | 168.10 | 173.60 | 185.30 | 190.80 |
| Fibonacci | 151.93 | 158.50 | 162.56 | 169.13 | 175.70 | 179.76 | 186.33 |
Numerical data
The following are the details of the technical indicators and moving averages that were collected to generate this technical analysis:
| RSI (14): | 47.44 | |
| MACD (12,26,9): | 0.2400 | |
| Directional Movement: | 3.48 | |
| AROON (14): | 71.43 | |
| DEMA (21): | 169.58 | |
| Parabolic SAR (0,02-0,02-0,2): | 172.78 | |
| Elder Ray (13): | -0.94 | |
| Super Trend (3,10): | 175.07 | |
| Zig ZAG (10): | 167.40 | |
| VORTEX (21): | 0.9000 | |
| Stochastique (14,3,5): | 46.00 | |
| TEMA (21): | 168.27 | |
| Williams %R (14): | -54.72 | |
| Chande Momentum Oscillator (20): | 2.40 | |
| Repulse (5,40,3): | -1.5300 | |
| ROCnROLL: | -1 | |
| TRIX (15,9): | 0.0500 | |
| Courbe Coppock: | 2.99 |
| MA7: | 169.23 | |
| MA20: | 169.81 | |
| MA50: | 166.99 | |
| MA100: | 160.96 | |
| MAexp7: | 168.68 | |
| MAexp20: | 168.94 | |
| MAexp50: | 166.59 | |
| MAexp100: | 162.12 | |
| Price / MA7: | -1.08% | |
| Price / MA20: | -1.42% | |
| Price / MA50: | +0.25% | |
| Price / MA100: | +4.00% | |
| Price / MAexp7: | -0.76% | |
| Price / MAexp20: | -0.91% | |
| Price / MAexp50: | +0.49% | |
| Price / MAexp100: | +3.26% |
News
The last news published on JUNGFRAUBAHN HLD N at the time of the generation of this analysis was as follows:
- EQS-Adhoc: Jungfraubahn Holding AG: 1.056 million guests at the Jungfraujoch - Top of Europe
- EQS-Adhoc: Jungfraubahn Holding AG: The Jungfrau Railways reorganise themselves
- EQS-Adhoc: Jungfraubahn Holding AG: The Jungfrau Railway Group is on a Successful Course
- EQS-Adhoc: Jungfraubahn Holding AG: 47.8 million Swiss francs profit for Jungfrau Railway Group
- EQS-Adhoc: Jungfraubahn Holding AG: Information regarding the supervisory authority's investigation
About author

Online


Add a comment
Comments
0 comments on the analysis JUNGFRAUBAHN HLD N - Daily