INFICON N - Daily - Technical analysis published on 01/27/2020 (GMT)
- 250
- 0
- Who voted?
Click here for a new analysis!
- Timeframe : Daily
- - Analysis generated on
- Status : TARGET REACHED

Summary of the analysis

Additional analysis
Quotes
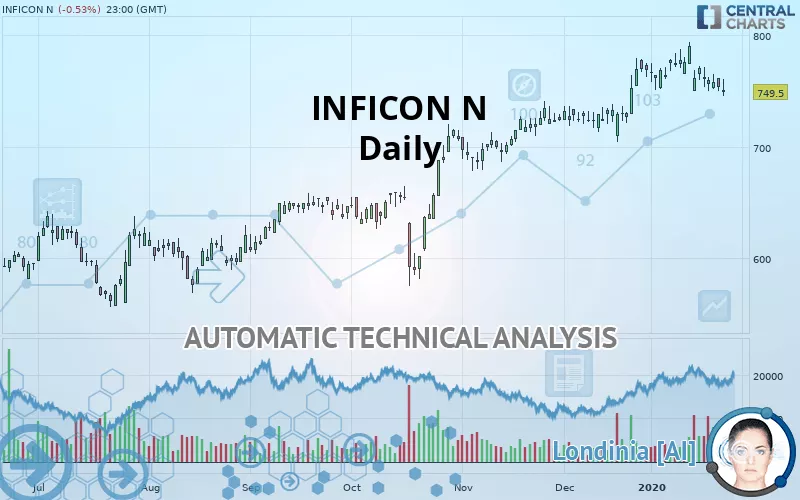
INFICON N rating 749.50 CHF. The price registered a decrease of -0.53% on the session with the lowest point at 745.50 CHF and the highest point at 760.50 CHF. The deviation from the price is +0.54% for the low point and -1.45% for the high point.The Central Gaps scanner detects a bearish opening marking the presence of sellers ahead of buyers at the opening but not sufficiently marked to allow the price to register a quotation gap.
Bearish opening
Type : Bearish
Timeframe : Openning
A study of price movements over other periods shows the following variations:
New HIGH record (5 years)
Type : Bullish
Timeframe : Weekly
Near a new HIGH record (1 year)
Type : Bullish
Timeframe : Weekly
Technical
A technical analysis in Daily of this INFICON N chart shows a bullish trend. 75% of the signals given by moving averages are bullish. Caution: the neutral signals currently given by the short-term moving averages indicate that this bullish trend is showing signs of running out of steam. The Central Indicators scanner detects bearish signals on moving averages that could impact this trend:
Bearish trend reversal : adaptative moving average 20
Type : Bearish
Timeframe : Daily
Bearish price crossover with Moving Average 20
Type : Bearish
Timeframe : Daily
Bearish price crossover with adaptative moving average 20
Type : Bearish
Timeframe : Daily
Technical indicators are slightly bearish. There is therefore considerable uncertainty about the continuation of the decline.
Caution: the Central Indicators scanner currently detects an excess:
Williams %R indicator is oversold : under -80
Type : Neutral
Timeframe : Daily
Parabolic SAR indicator bearish reversal
Type : Bearish
Timeframe : Daily
Price is back over the pivot point
Type : Bullish
Timeframe : Weekly
Price is back under the pivot point
Type : Bearish
Timeframe : Daily
The Central Patterns scanner, which studies chart patterns, resistances and supports, has identified this signal:
Near support of channel
Type : Bullish
Timeframe : Daily
The Central Candlesticks scanner which studies Japanese candlesticks did not detect anything.
| S3 | S2 | S1 | Price | R1 | R2 | |
|---|---|---|---|---|---|---|
| ProTrendLines | 637.89 | 658.00 | 723.75 | 749.50 | 770.00 | 790.50 |
| Change (%) | -14.89% | -12.21% | -3.44% | - | +2.74% | +5.47% |
| Change | -111.61 | -91.50 | -25.75 | - | +20.50 | +41.00 |
| Level | Minor | Major | Intermediate | - | Minor | Major |
Pivot points can also be used to set your price objectives. Here is the price situation in relation to pivot points:
| Pivot points | S3 | S2 | S1 | PP | R1 | R2 | R3 |
|---|---|---|---|---|---|---|---|
| Standard | 737.50 | 744.00 | 750.00 | 756.50 | 762.50 | 769.00 | 775.00 |
| Camarilla | 752.56 | 753.71 | 754.85 | 756.00 | 757.15 | 758.29 | 759.44 |
| Woodie | 737.25 | 743.88 | 749.75 | 756.38 | 762.25 | 768.88 | 774.75 |
| Fibonacci | 744.00 | 748.78 | 751.73 | 756.50 | 761.28 | 764.23 | 769.00 |
| Pivot points | S3 | S2 | S1 | PP | R1 | R2 | R3 |
|---|---|---|---|---|---|---|---|
| Standard | 722.00 | 736.50 | 755.00 | 769.50 | 788.00 | 802.50 | 821.00 |
| Camarilla | 764.43 | 767.45 | 770.48 | 773.50 | 776.53 | 779.55 | 782.58 |
| Woodie | 724.00 | 737.50 | 757.00 | 770.50 | 790.00 | 803.50 | 823.00 |
| Fibonacci | 736.50 | 749.11 | 756.89 | 769.50 | 782.11 | 789.89 | 802.50 |
| Pivot points | S3 | S2 | S1 | PP | R1 | R2 | R3 |
|---|---|---|---|---|---|---|---|
| Standard | 647.17 | 675.83 | 722.17 | 750.83 | 797.17 | 825.83 | 872.17 |
| Camarilla | 747.88 | 754.75 | 761.63 | 768.50 | 775.38 | 782.25 | 789.13 |
| Woodie | 656.00 | 680.25 | 731.00 | 755.25 | 806.00 | 830.25 | 881.00 |
| Fibonacci | 675.83 | 704.48 | 722.18 | 750.83 | 779.48 | 797.18 | 825.83 |
Numerical data
The following are the details of the technical indicators and moving averages that were collected to generate this technical analysis:
| RSI (14): | 51.69 | |
| MACD (12,26,9): | 8.9000 | |
| Directional Movement: | 1.74 | |
| AROON (14): | -7.14 | |
| DEMA (21): | 774.31 | |
| Parabolic SAR (0,02-0,02-0,2): | 793.13 | |
| Elder Ray (13): | -6.04 | |
| Super Trend (3,10): | 735.38 | |
| Zig ZAG (10): | 758.50 | |
| VORTEX (21): | 1.0200 | |
| Stochastique (14,3,5): | 20.83 | |
| TEMA (21): | 770.27 | |
| Williams %R (14): | -80.68 | |
| Chande Momentum Oscillator (20): | -3.00 | |
| Repulse (5,40,3): | 1.3900 | |
| ROCnROLL: | -1 | |
| TRIX (15,9): | 0.2500 | |
| Courbe Coppock: | 2.74 |
| MA7: | 768.14 | |
| MA20: | 764.30 | |
| MA50: | 737.04 | |
| MA100: | 692.01 | |
| MAexp7: | 764.49 | |
| MAexp20: | 760.52 | |
| MAexp50: | 736.17 | |
| MAexp100: | 700.69 | |
| Price / MA7: | -2.43% | |
| Price / MA20: | -1.94% | |
| Price / MA50: | +1.69% | |
| Price / MA100: | +8.31% | |
| Price / MAexp7: | -1.96% | |
| Price / MAexp20: | -1.45% | |
| Price / MAexp50: | +1.81% | |
| Price / MAexp100: | +6.97% |
News
The last news published on INFICON N at the time of the generation of this analysis was as follows:
 INFICON Holding
About author

Online


Add a comment
Comments
0 comments on the analysis INFICON N - Daily