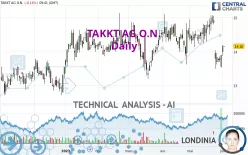
TAKKT AG O.N. - Daily - Technical analysis published on 06/02/2023 (GMT)
- 144
- 0
Click here for a new analysis!
- Timeframe : Daily
- - Analysis generated on
- Status : LEVEL MAINTAINED

Summary of the analysis

Additional analysis
Quotes
The TAKKT AG O.N. price is 14.16 EUR. The price registered a decrease of -0.14% on the session and was traded between 14.16 EUR and 14.16 EUR over the period. The price is currently at 0% from its lowest and 0% from its highest.The Central Gaps scanner detects a bearish opening. A small advantage for sellers in the very short term.
Bearish opening
Type : Bearish
Timeframe : Openning
A study of price movements over other periods shows the following variations:
Technical
Technical analysis of this Daily chart of TAKKT AG O.N. indicates that the overall trend is strongly bullish. The signals given by the moving averages are 92.86% bullish. This strong bullish trend is confirmed by the strong signals currently being given by short-term moving averages. The Central Indicators market scanner is currently detecting several bullish signals that could impact this trend:
Bullish trend reversal : Moving Average 20
Type : Bullish
Timeframe : Daily
Bullish trend reversal : Moving Average 100
Type : Bullish
Timeframe : Daily
Bullish trend reversal : adaptative moving average 20
Type : Bullish
Timeframe : Daily
Bullish trend reversal : adaptative moving average 50
Type : Bullish
Timeframe : Daily
In fact, 10 technical indicators on 18 studied are currently positioned bullish. Central Indicators, the scanner specialised in technical indicators, has identified these signals:
Price is back over the pivot point
Type : Bullish
Timeframe : Weekly
Momentum indicator is back under 0
Type : Bearish
Timeframe : Daily
Central Patterns, the market scanner focusing on chart patterns, resistances and supports found these results:
Near support of channel
Type : Bullish
Timeframe : Daily
Near support of triangle
Type : Bullish
Timeframe : Daily
Central Candlesticks, the scanner specialised in Japanese candlesticks, detects these signals that could have an impact on the current short-term trend:
Doji
Type : Neutral
Timeframe : Daily
Bearish harami cross
Type : Bearish
Timeframe : Daily
| S3 | S2 | S1 | Price | R1 | R2 | R3 | |
|---|---|---|---|---|---|---|---|
| ProTrendLines | 9.93 | 11.96 | 13.17 | 14.16 | 14.33 | 15.35 | 17.52 |
| Change (%) | -29.87% | -15.54% | -6.99% | - | +1.20% | +8.40% | +23.73% |
| Change | -4.23 | -2.20 | -0.99 | - | +0.17 | +1.19 | +3.36 |
| Level | Major | Intermediate | Major | - | Major | Major | Minor |
Pivot points can also be used to set your price objectives. Here is the price situation in relation to pivot points:
| Pivot points | S3 | S2 | S1 | PP | R1 | R2 | R3 |
|---|---|---|---|---|---|---|---|
| Standard | 13.68 | 13.78 | 13.98 | 14.08 | 14.28 | 14.38 | 14.58 |
| Camarilla | 14.10 | 14.13 | 14.15 | 14.18 | 14.21 | 14.24 | 14.26 |
| Woodie | 13.73 | 13.81 | 14.03 | 14.11 | 14.33 | 14.41 | 14.63 |
| Fibonacci | 13.78 | 13.90 | 13.97 | 14.08 | 14.20 | 14.27 | 14.38 |
| Pivot points | S3 | S2 | S1 | PP | R1 | R2 | R3 |
|---|---|---|---|---|---|---|---|
| Standard | 12.07 | 12.79 | 13.24 | 13.96 | 14.41 | 15.13 | 15.58 |
| Camarilla | 13.38 | 13.49 | 13.59 | 13.70 | 13.81 | 13.92 | 14.02 |
| Woodie | 11.95 | 12.72 | 13.12 | 13.89 | 14.29 | 15.06 | 15.46 |
| Fibonacci | 12.79 | 13.23 | 13.51 | 13.96 | 14.40 | 14.68 | 15.13 |
| Pivot points | S3 | S2 | S1 | PP | R1 | R2 | R3 |
|---|---|---|---|---|---|---|---|
| Standard | 12.21 | 12.85 | 13.38 | 14.02 | 14.55 | 15.19 | 15.72 |
| Camarilla | 13.58 | 13.69 | 13.79 | 13.90 | 14.01 | 14.12 | 14.22 |
| Woodie | 12.15 | 12.82 | 13.32 | 13.99 | 14.49 | 15.16 | 15.66 |
| Fibonacci | 12.85 | 13.30 | 13.58 | 14.02 | 14.47 | 14.75 | 15.19 |
Numerical data
The following is the status of the technical indicators and moving averages at the time of publication of this technical analysis:
| RSI (14): | 52.29 | |
| MACD (12,26,9): | -0.0100 | |
| Directional Movement: | -7.26 | |
| AROON (14): | -21.43 | |
| DEMA (21): | 14.08 | |
| Parabolic SAR (0,02-0,02-0,2): | 14.54 | |
| Elder Ray (13): | 0.09 | |
| Super Trend (3,10): | 13.49 | |
| Zig ZAG (10): | 14.16 | |
| VORTEX (21): | 1.0700 | |
| Stochastique (14,3,5): | 49.57 | |
| TEMA (21): | 14.02 | |
| Williams %R (14): | -43.59 | |
| Chande Momentum Oscillator (20): | -0.12 | |
| Repulse (5,40,3): | 2.6800 | |
| ROCnROLL: | 1 | |
| TRIX (15,9): | 0.0200 | |
| Courbe Coppock: | 2.15 |
| MA7: | 13.90 | |
| MA20: | 14.13 | |
| MA50: | 14.04 | |
| MA100: | 13.92 | |
| MAexp7: | 14.04 | |
| MAexp20: | 14.08 | |
| MAexp50: | 14.01 | |
| MAexp100: | 13.81 | |
| Price / MA7: | +1.87% | |
| Price / MA20: | +0.21% | |
| Price / MA50: | +0.85% | |
| Price / MA100: | +1.72% | |
| Price / MAexp7: | +0.85% | |
| Price / MAexp20: | +0.57% | |
| Price / MAexp50: | +1.07% | |
| Price / MAexp100: | +2.53% |
News
Don't forget to follow the news on TAKKT AG O.N.. At the time of publication of this analysis, the latest news was as follows:
- EQS-News: TAKKT AG: Shareholders' Meeting approves special dividend and thus a total payment of EUR 1.00 per share
- EQS-News: TAKKT AG: TAKKT increases gross profit margin and free cash flow in first quarter
- EQS-News: TAKKT AG: TAKKT makes significant progress in implementing the strategy and wants to significantly increase free cash flow in 2023
- EQS-News: TAKKT AG: TAKKT achieves financial and strategic targets for 2022 and proposes special dividend
- EQS-Adhoc: TAKKT AG: Management Board proposes special dividend for the fiscal year 2022
About author
Online


Add a comment
Comments
0 comments on the analysis TAKKT AG O.N. - Daily