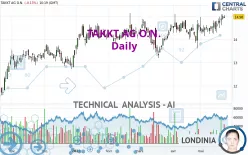
TAKKT AG O.N. - Daily - Technical analysis published on 05/24/2023 (GMT)
- 152
- 0
Click here for a new analysis!
- Timeframe : Daily
- - Analysis generated on
- Status : INVALID

Summary of the analysis

Additional analysis
Quotes
TAKKT AG O.N. rating 14.98 EUR. The price is lower by -0.13% since the last closing with the lowest point at 14.92 EUR and the highest point at 15.06 EUR. The deviation from the price is +0.40% for the low point and -0.53% for the high point.The Central Gaps scanner detects a bearish opening marking the presence of sellers ahead of buyers at the opening but not sufficiently marked to allow the price to register a quotation gap.
Bearish opening
Type : Bearish
Timeframe : Openning
Here is a more detailed summary of the historical variations registered by TAKKT AG O.N.:
Near a new HIGH record (1st january)
Type : Bullish
Timeframe : Weekly
Near a new HIGH record (1 month)
Type : Bullish
Timeframe : Weekly
Technical
Technical analysis of TAKKT AG O.N. in Daily shows a strongly overall bullish trend. The signals given by the moving averages are 92.86% bullish. This strong bullish trend is confirmed by the strong signals currently being given by short-term moving averages. There is no crossing of moving average by the price or crossing of moving averages between themselves.
Technical indicators are strongly bullish, suggesting that the price increase should continue.
Caution: the Central Indicators scanner currently detects an excess:
CCI indicator is overbought : over 100
Type : Neutral
Timeframe : Daily
CCI indicator: bearish divergence
Type : Bearish
Timeframe : Daily
Williams %R indicator is overbought : over -20
Type : Neutral
Timeframe : Daily
Price is back over the pivot point
Type : Bullish
Timeframe : Daily
An analysis of the price chart with the Central Patterns scanner (detector of chart patterns and resistances and supports) shows a result that can have an impact on the price change:
Near resistance of channel
Type : Bearish
Timeframe : Daily
The Central Candlesticks scanner, specialised in Japanese candlesticks, did not identify any signals.
| S3 | S2 | S1 | Price | R1 | R2 | R3 | |
|---|---|---|---|---|---|---|---|
| ProTrendLines | 13.54 | 13.97 | 14.72 | 14.98 | 15.77 | 18.01 | 22.17 |
| Change (%) | -9.61% | -6.74% | -1.74% | - | +5.27% | +20.23% | +48.00% |
| Change | -1.44 | -1.01 | -0.26 | - | +0.79 | +3.03 | +7.19 |
| Level | Major | Intermediate | Major | - | Major | Minor | Major |
To determine price objectives, it is also possible to use the pivot points. Here is the price position in relation to pivot points:
| Pivot points | S3 | S2 | S1 | PP | R1 | R2 | R3 |
|---|---|---|---|---|---|---|---|
| Standard | 14.63 | 14.73 | 14.87 | 14.97 | 15.11 | 15.21 | 15.35 |
| Camarilla | 14.93 | 14.96 | 14.98 | 15.00 | 15.02 | 15.04 | 15.07 |
| Woodie | 14.64 | 14.74 | 14.88 | 14.98 | 15.12 | 15.22 | 15.36 |
| Fibonacci | 14.73 | 14.83 | 14.88 | 14.97 | 15.07 | 15.12 | 15.21 |
| Pivot points | S3 | S2 | S1 | PP | R1 | R2 | R3 |
|---|---|---|---|---|---|---|---|
| Standard | 13.63 | 13.93 | 14.37 | 14.67 | 15.11 | 15.41 | 15.85 |
| Camarilla | 14.60 | 14.66 | 14.73 | 14.80 | 14.87 | 14.94 | 15.00 |
| Woodie | 13.69 | 13.97 | 14.43 | 14.71 | 15.17 | 15.45 | 15.91 |
| Fibonacci | 13.93 | 14.22 | 14.39 | 14.67 | 14.96 | 15.13 | 15.41 |
| Pivot points | S3 | S2 | S1 | PP | R1 | R2 | R3 |
|---|---|---|---|---|---|---|---|
| Standard | 12.25 | 12.93 | 13.73 | 14.41 | 15.21 | 15.89 | 16.69 |
| Camarilla | 14.11 | 14.25 | 14.38 | 14.52 | 14.66 | 14.79 | 14.93 |
| Woodie | 12.30 | 12.96 | 13.78 | 14.44 | 15.26 | 15.92 | 16.74 |
| Fibonacci | 12.93 | 13.50 | 13.85 | 14.41 | 14.98 | 15.33 | 15.89 |
Numerical data
The following is the status of technical indicators and moving averages registered at the time this technical analysis was created:
| RSI (14): | 62.17 | |
| MACD (12,26,9): | 0.1400 | |
| Directional Movement: | 3.85 | |
| AROON (14): | 78.57 | |
| DEMA (21): | 14.80 | |
| Parabolic SAR (0,02-0,02-0,2): | 14.35 | |
| Elder Ray (13): | 0.28 | |
| Super Trend (3,10): | 13.96 | |
| Zig ZAG (10): | 14.98 | |
| VORTEX (21): | 1.0600 | |
| Stochastique (14,3,5): | 85.82 | |
| TEMA (21): | 14.89 | |
| Williams %R (14): | -6.38 | |
| Chande Momentum Oscillator (20): | 0.54 | |
| Repulse (5,40,3): | 1.3200 | |
| ROCnROLL: | 1 | |
| TRIX (15,9): | 0.0900 | |
| Courbe Coppock: | 5.63 |
| MA7: | 14.79 | |
| MA20: | 14.57 | |
| MA50: | 14.34 | |
| MA100: | 14.30 | |
| MAexp7: | 14.83 | |
| MAexp20: | 14.63 | |
| MAexp50: | 14.44 | |
| MAexp100: | 14.19 | |
| Price / MA7: | +1.28% | |
| Price / MA20: | +2.81% | |
| Price / MA50: | +4.46% | |
| Price / MA100: | +4.76% | |
| Price / MAexp7: | +1.01% | |
| Price / MAexp20: | +2.39% | |
| Price / MAexp50: | +3.74% | |
| Price / MAexp100: | +5.57% |
News
The last news published on TAKKT AG O.N. at the time of the generation of this analysis was as follows:
- EQS-News: TAKKT AG: TAKKT increases gross profit margin and free cash flow in first quarter
- EQS-News: TAKKT AG: TAKKT makes significant progress in implementing the strategy and wants to significantly increase free cash flow in 2023
- EQS-News: TAKKT AG: TAKKT achieves financial and strategic targets for 2022 and proposes special dividend
- EQS-Adhoc: TAKKT AG: Management Board proposes special dividend for the fiscal year 2022
- EQS-News: TAKKT AG: Strong sales and earnings growth despite challenging environment
About author
Online


Add a comment
Comments
0 comments on the analysis TAKKT AG O.N. - Daily