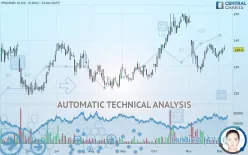
YPSOMED HLDG - Daily - Technical analysis published on 12/06/2019 (GMT)
- 155
- 0
- Who voted?
Click here for a new analysis!
- Timeframe : Daily
- - Analysis generated on
- Status : LEVEL MAINTAINED

Summary of the analysis

Additional analysis
Quotes
YPSOMED HLDG rating 136.40 CHF. The price has increased by +0.00% since the last closing with the lowest point at 136.20 CHF and the highest point at 138.20 CHF. The deviation from the price is +0.15% for the low point and -1.30% for the high point.The Central Gaps scanner detects a bearish opening marking the presence of sellers ahead of buyers at the opening but not sufficiently marked to allow the price to register a quotation gap.
Bearish opening
Type : Bearish
Timeframe : Openning
So that you have an overall view of the price change, here is a table showing the variations over several periods:
Near a new HIGH record (1 month)
Type : Bullish
Timeframe : Weekly
Technical
A technical analysis in Daily of this YPSOMED HLDG chart shows a bullish trend. 75% of the signals given by moving averages are bullish. The overall trend seems to be showing some signs of weakness, as do the tentative bullish signals given by short-term moving averages. The Central Indicators market scanner is currently detecting several bullish signals that could impact this trend:
Bullish trend reversal : Moving Average 100
Type : Bullish
Timeframe : Daily
Bullish price crossover with Moving Average 20
Type : Bullish
Timeframe : Daily
In fact, 11 technical indicators on 18 studied are currently bullish. Other results related to technical indicators were also found by the Central Indicators scanner:
MACD crosses UP its Moving Average
Type : Bullish
Timeframe : Daily
Price is back over the pivot point
Type : Bullish
Timeframe : Daily
Price is back over the pivot point
Type : Bullish
Timeframe : Weekly
No signals are given by Central Patterns, a market scanner specialised in chart patterns, resistances and supports.
The Central Candlesticks scanner which studies Japanese candlesticks did not detect anything.
| S3 | S2 | S1 | Price | R1 | R2 | R3 | |
|---|---|---|---|---|---|---|---|
| ProTrendLines | 125.95 | 129.67 | 135.00 | 136.40 | 138.20 | 147.00 | 150.00 |
| Change (%) | -7.66% | -4.93% | -1.03% | - | +1.32% | +7.77% | +9.97% |
| Change | -10.45 | -6.73 | -1.40 | - | +1.80 | +10.60 | +13.60 |
| Level | Minor | Major | Major | - | Major | Minor | Minor |
Pivot points can also be used to set your price objectives. Here is the price situation in relation to pivot points:
| Pivot points | S3 | S2 | S1 | PP | R1 | R2 | R3 |
|---|---|---|---|---|---|---|---|
| Standard | 133.07 | 133.73 | 134.67 | 135.33 | 136.27 | 136.93 | 137.87 |
| Camarilla | 135.16 | 135.31 | 135.45 | 135.60 | 135.75 | 135.89 | 136.04 |
| Woodie | 133.20 | 133.80 | 134.80 | 135.40 | 136.40 | 137.00 | 138.00 |
| Fibonacci | 133.73 | 134.35 | 134.72 | 135.33 | 135.95 | 136.32 | 136.93 |
| Pivot points | S3 | S2 | S1 | PP | R1 | R2 | R3 |
|---|---|---|---|---|---|---|---|
| Standard | 126.87 | 129.73 | 133.27 | 136.13 | 139.67 | 142.53 | 146.07 |
| Camarilla | 135.04 | 135.63 | 136.21 | 136.80 | 137.39 | 137.97 | 138.56 |
| Woodie | 127.20 | 129.90 | 133.60 | 136.30 | 140.00 | 142.70 | 146.40 |
| Fibonacci | 129.73 | 132.18 | 133.69 | 136.13 | 138.58 | 140.09 | 142.53 |
| Pivot points | S3 | S2 | S1 | PP | R1 | R2 | R3 |
|---|---|---|---|---|---|---|---|
| Standard | 103.33 | 115.47 | 125.13 | 137.27 | 146.93 | 159.07 | 168.73 |
| Camarilla | 128.81 | 130.80 | 132.80 | 134.80 | 136.80 | 138.80 | 140.80 |
| Woodie | 102.10 | 114.85 | 123.90 | 136.65 | 145.70 | 158.45 | 167.50 |
| Fibonacci | 115.47 | 123.79 | 128.94 | 137.27 | 145.59 | 150.74 | 159.07 |
Numerical data
The following is the status of technical indicators and moving averages registered at the time this technical analysis was created:
| RSI (14): | 49.22 | |
| MACD (12,26,9): | -0.8400 | |
| Directional Movement: | -7.11 | |
| AROON (14): | 42.86 | |
| DEMA (21): | 134.83 | |
| Parabolic SAR (0,02-0,02-0,2): | 132.00 | |
| Elder Ray (13): | 0.23 | |
| Super Trend (3,10): | 141.18 | |
| Zig ZAG (10): | 136.00 | |
| VORTEX (21): | 0.9100 | |
| Stochastique (14,3,5): | 68.16 | |
| TEMA (21): | 133.86 | |
| Williams %R (14): | -28.85 | |
| Chande Momentum Oscillator (20): | 3.60 | |
| Repulse (5,40,3): | 0.6300 | |
| ROCnROLL: | 1 | |
| TRIX (15,9): | -0.1300 | |
| Courbe Coppock: | 3.82 |
| MA7: | 135.14 | |
| MA20: | 134.17 | |
| MA50: | 137.78 | |
| MA100: | 132.74 | |
| MAexp7: | 135.31 | |
| MAexp20: | 135.95 | |
| MAexp50: | 136.00 | |
| MAexp100: | 134.09 | |
| Price / MA7: | +0.93% | |
| Price / MA20: | +1.66% | |
| Price / MA50: | -1.00% | |
| Price / MA100: | +2.76% | |
| Price / MAexp7: | +0.81% | |
| Price / MAexp20: | +0.33% | |
| Price / MAexp50: | +0.29% | |
| Price / MAexp100: | +1.72% |
About author

Online


Add a comment
Comments
0 comments on the analysis YPSOMED HLDG - Daily