| Open: | - |
| Change: | - |
| Volume: | - |
| Low: | - |
| High: | - |
| High / Low range: | - |
| Type: | Stocks |
| Ticker: | CMBN |
| ISIN: | CH0225173167 |
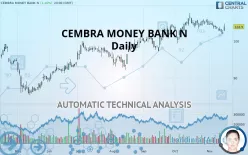
CEMBRA MONEY BANK N - Daily - Technical analysis published on 11/18/2019 (GMT)
- 256
- 0
- 11/18/2019 - 11:14
- Who voted?
Click here for a new analysis!
- Timeframe : Daily
- - Analysis generated on 11/18/2019 - 11:13
- Status : TARGET REACHED

Summary of the analysis

Additional analysis
Quotes
CEMBRA MONEY BANK N rating 103.90 CHF. The price has increased by +1.47% since the last closing with the lowest point at 102.80 CHF and the highest point at 104.70 CHF. The deviation from the price is +1.07% for the low point and -0.76% for the high point.A bearish opening was detected by the Central Gaps scanner. Sellers are trying to impose a bearish trend in the very short term.
Bearish opening
Type : Bearish
Timeframe : Openning
A study of price movements over other periods shows the following variations:
Near a new HIGH record (5 years)
Type : Bullish
Timeframe : Weekly
Near a new HIGH record (1 year)
Type : Bullish
Timeframe : Weekly
Near a new HIGH record (1st january)
Type : Bullish
Timeframe : Weekly
Near a new HIGH record (1 month)
Type : Bullish
Timeframe : Weekly
Technical
Technical analysis of this Daily chart of CEMBRA MONEY BANK N indicates that the overall trend is bullish. The signals given by moving averages are 64.29% bullish. This bullish trend could slow down given the neutral signals currently being given by short-term moving averages. The Central Indicators scanner detects bearish signals on moving averages that could impact this trend:
Bearish price crossover with Moving Average 50
Type : Bearish
Timeframe : Daily
Bearish price crossover with adaptative moving average 20
Type : Bearish
Timeframe : Daily
Technical indicators are bearish. There is still some doubt about the decline in the price.
But beware of excesses. The Central Indicators scanner currently detects this:
CCI indicator is oversold : under -100
Type : Neutral
Timeframe : Daily
Williams %R indicator is oversold : under -80
Type : Neutral
Timeframe : Daily
Pivot points : price is under support 1
Type : Neutral
Timeframe : Daily
Pivot points : price is under support 1
Type : Neutral
Timeframe : Weekly
MACD indicator is back under 0
Type : Bearish
Timeframe : Daily
Central Patterns, the scanner specializing in chart patterns, did not identify any signals.
The Central Candlesticks scanner which studies Japanese candlesticks did not detect anything.
| S3 | S2 | S1 | Price | R1 | R2 | |
|---|---|---|---|---|---|---|
| ProTrendLines | 85.80 | 93.46 | 99.25 | 103.90 | 103.92 | 105.56 |
| Change (%) | -17.42% | -10.05% | -4.48% | - | +0.02% | +1.60% |
| Change | -18.10 | -10.44 | -4.65 | - | +0.02 | +1.66 |
| Level | Minor | Major | Major | - | Minor | Intermediate |
Attention could also be paid to pivot points to set price objectives:
| Pivot points | S3 | S2 | S1 | PP | R1 | R2 | R3 |
|---|---|---|---|---|---|---|---|
| Standard | 101.67 | 102.23 | 102.77 | 103.33 | 103.87 | 104.43 | 104.97 |
| Camarilla | 103.00 | 103.10 | 103.20 | 103.30 | 103.40 | 103.50 | 103.60 |
| Woodie | 101.65 | 102.23 | 102.75 | 103.33 | 103.85 | 104.43 | 104.95 |
| Fibonacci | 102.23 | 102.65 | 102.91 | 103.33 | 103.75 | 104.01 | 104.43 |
| Pivot points | S3 | S2 | S1 | PP | R1 | R2 | R3 |
|---|---|---|---|---|---|---|---|
| Standard | 102.33 | 103.37 | 103.93 | 104.97 | 105.53 | 106.57 | 107.13 |
| Camarilla | 104.06 | 104.21 | 104.35 | 104.50 | 104.65 | 104.79 | 104.94 |
| Woodie | 102.10 | 103.25 | 103.70 | 104.85 | 105.30 | 106.45 | 106.90 |
| Fibonacci | 103.37 | 103.98 | 104.36 | 104.97 | 105.58 | 105.96 | 106.57 |
| Pivot points | S3 | S2 | S1 | PP | R1 | R2 | R3 |
|---|---|---|---|---|---|---|---|
| Standard | 91.63 | 95.47 | 99.93 | 103.77 | 108.23 | 112.07 | 116.53 |
| Camarilla | 102.12 | 102.88 | 103.64 | 104.40 | 105.16 | 105.92 | 106.68 |
| Woodie | 91.95 | 95.63 | 100.25 | 103.93 | 108.55 | 112.23 | 116.85 |
| Fibonacci | 95.47 | 98.64 | 100.60 | 103.77 | 106.94 | 108.90 | 112.07 |
Numerical data
The following is the status of technical indicators and moving averages registered at the time this technical analysis was created:
| RSI (14): | 40.77 | |
| MACD (12,26,9): | -0.0500 | |
| Directional Movement: | -8.37 | |
| AROON (14): | -64.29 | |
| DEMA (21): | 104.08 | |
| Parabolic SAR (0,02-0,02-0,2): | 106.27 | |
| Elder Ray (13): | -1.31 | |
| Super Trend (3,10): | 101.60 | |
| Zig ZAG (10): | 102.50 | |
| VORTEX (21): | 0.8300 | |
| Stochastique (14,3,5): | 18.30 | |
| TEMA (21): | 103.25 | |
| Williams %R (14): | -83.33 | |
| Chande Momentum Oscillator (20): | -2.80 | |
| Repulse (5,40,3): | -0.5800 | |
| ROCnROLL: | -1 | |
| TRIX (15,9): | 0.0500 | |
| Courbe Coppock: | 2.60 |
| MA7: | 103.49 | |
| MA20: | 104.36 | |
| MA50: | 103.05 | |
| MA100: | 100.08 | |
| MAexp7: | 103.42 | |
| MAexp20: | 103.91 | |
| MAexp50: | 102.77 | |
| MAexp100: | 100.27 | |
| Price / MA7: | +0.40% | |
| Price / MA20: | -0.44% | |
| Price / MA50: | +0.82% | |
| Price / MA100: | +3.82% | |
| Price / MAexp7: | +0.46% | |
| Price / MAexp20: | -0.01% | |
| Price / MAexp50: | +1.10% | |
| Price / MAexp100: | +3.62% |
News
Don"t forget to follow the news on CEMBRA MONEY BANK N. At the time of publication of this analysis, the latest news was as follows:
-
02/08/2017 - 13:41
 Cembra Money Bank
-
12/15/2016 - 00:41
Cembra Money Bank
About author

Online


Add a comment
Comments
0 comments on the analysis CEMBRA MONEY BANK N - Daily