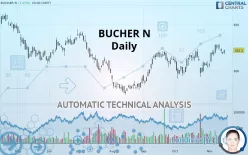
BUCHER N - Daily - Technical analysis published on 11/18/2019 (GMT)
- 273
- 0
- Who voted?
Oops, I was wrong about that analysis. My threshold for invalidation has been broken.
Click here for a new analysis!
Click here for a new analysis!
- Timeframe : Daily
- - Analysis generated on
- Status : INVALID

Summary of the analysis
Trends
Court terme:
Strongly bullish
De fond:
Strongly bullish
Technical indicators
61%
6%
33%
My opinion
Bullish above 320.67 CHF
My targets
339.00 CHF (+5.21%)
347.00 CHF (+7.70%)
My analysis
All elements being clearly bullish, it would be possible for traders to trade only long positions (at the time of purchase) on BUCHER N as long as the price remains well above 320.67 CHF. The buyers” bullish objective is set at 339.00 CHF. A bullish break in this resistance would boost the bullish momentum. The buyers could then target the resistance located at 347.00 CHF. If there is any crossing, the next objective would be the resistance located at 360.20 CHF. However, beware of bullish excesses that could lead to a possible short-term correction; but this possible correction would not be tradeable.
Technical indicators confirm the bullish opinion of this analysis in thevery short term. However, be careful of excessive bullish movements. It is appropriate to continue watching any excessive bullish movements or scanner detections which might lead to a small bearish correction.
FORCE
0
10
6.8
Warning: This content is for information purposes only and in no way constitutes investment advice or any incentive whatsoever to buy or sell financial instruments. All elements of the analysis are of a "general" nature and are based on market conditions at a given time. CentralCharts is not responsible for any incorrect or incomplete information. Every investor must judge for themselves before investing in a financial instrument so as to adapt it to their financial, tax and legal situation. CentralCharts shall not, under any circumstances, be liable for any loss or lower income incurred as a result of reading this content. Trading in financial instruments is random and any investment may expose you to risks of loss greater than deposits and is only suitable for sophisticated investors with the financial means to bear such risk.

This analysis was given by Vincent Launay. Take part yourself by sharing additional analysis on another time unit:
Additional analysis
Quotes
The BUCHER N price is 322.20 CHF. The price has increased by +1.07% since the last closing and was between 318.20 CHF and 322.80 CHF. This implies that the price is at +1.26% from its lowest and at -0.19% from its highest.318.20
322.80
322.20
The Central Gaps scanner detects a bearish opening marking the presence of sellers ahead of buyers at the opening but not sufficiently marked to allow the price to register a quotation gap.
Bearish opening
Type : Bearish
Timeframe : Openning
So that you have an overall view of the price change, here is a table showing the variations over several periods:
Near a new HIGH record (1 month)
Type : Bullish
Timeframe : Weekly
Technical
Technical analysis of this Daily chart of BUCHER N indicates that the overall trend is strongly bullish. 82.14% of the signals given by moving averages are bullish. The overall trend is supported by the strong bullish signals from short-term moving averages. The Central Indicators scanner does not detect any result on moving averages that would impact this trend.
In fact, 11 technical indicators on 18 studied are currently bullish. Caution: the Central Indicators scanner currently detects an excess:
Williams %R indicator is overbought : over -20
Type : Neutral
Timeframe : Daily
Pivot points : price is over resistance 3
Type : Neutral
Timeframe : Weekly
Pivot points : price is under support 1
Type : Neutral
Timeframe : Daily
The analysis of the price chart with Central Patterns scanners does not return any result.
No result was found by the Central Candlesticks scanner on Japanese candlesticks.
ProTrendLines
S3
S2
S1
R1
R2
R3
Price
| S3 | S2 | S1 | Price | R1 | R2 | R3 | |
|---|---|---|---|---|---|---|---|
| ProTrendLines | 297.60 | 314.25 | 320.67 | 322.20 | 339.00 | 347.00 | 360.20 |
| Change (%) | -7.64% | -2.47% | -0.47% | - | +5.21% | +7.70% | +11.79% |
| Change | -24.60 | -7.95 | -1.53 | - | +16.80 | +24.80 | +38.00 |
| Level | Intermediate | Major | Intermediate | - | Intermediate | Minor | Major |
To determine price objectives, it is also possible to use the pivot points. Here is the price position in relation to pivot points:
Daily
| Pivot points | S3 | S2 | S1 | PP | R1 | R2 | R3 |
|---|---|---|---|---|---|---|---|
| Standard | 317.60 | 320.40 | 323.20 | 326.00 | 328.80 | 331.60 | 334.40 |
| Camarilla | 324.46 | 324.97 | 325.49 | 326.00 | 326.51 | 327.03 | 327.54 |
| Woodie | 317.60 | 320.40 | 323.20 | 326.00 | 328.80 | 331.60 | 334.40 |
| Fibonacci | 320.40 | 322.54 | 323.86 | 326.00 | 328.14 | 329.46 | 331.60 |
Weekly
| Pivot points | S3 | S2 | S1 | PP | R1 | R2 | R3 |
|---|---|---|---|---|---|---|---|
| Standard | 289.00 | 294.00 | 300.20 | 305.20 | 311.40 | 316.40 | 322.60 |
| Camarilla | 303.32 | 304.35 | 305.37 | 306.40 | 307.43 | 308.45 | 309.48 |
| Woodie | 289.60 | 294.30 | 300.80 | 305.50 | 312.00 | 316.70 | 323.20 |
| Fibonacci | 294.00 | 298.28 | 300.92 | 305.20 | 309.48 | 312.12 | 316.40 |
Monthly
| Pivot points | S3 | S2 | S1 | PP | R1 | R2 | R3 |
|---|---|---|---|---|---|---|---|
| Standard | 257.00 | 274.20 | 289.40 | 306.60 | 321.80 | 339.00 | 354.20 |
| Camarilla | 295.69 | 298.66 | 301.63 | 304.60 | 307.57 | 310.54 | 313.51 |
| Woodie | 256.00 | 273.70 | 288.40 | 306.10 | 320.80 | 338.50 | 353.20 |
| Fibonacci | 274.20 | 286.58 | 294.22 | 306.60 | 318.98 | 326.62 | 339.00 |
Numerical data
The following is the status of the technical indicators and moving averages at the time of publication of this technical analysis:
Technical indicators
Moving averages
| RSI (14): | 56.75 | |
| MACD (12,26,9): | 4.5200 | |
| Directional Movement: | 4.92 | |
| AROON (14): | 92.86 | |
| DEMA (21): | 322.03 | |
| Parabolic SAR (0,02-0,02-0,2): | 306.27 | |
| Elder Ray (13): | 2.10 | |
| Super Trend (3,10): | 304.60 | |
| Zig ZAG (10): | 321.40 | |
| VORTEX (21): | 1.0300 | |
| Stochastique (14,3,5): | 87.84 | |
| TEMA (21): | 324.49 | |
| Williams %R (14): | -24.03 | |
| Chande Momentum Oscillator (20): | 13.00 | |
| Repulse (5,40,3): | 1.0500 | |
| ROCnROLL: | 1 | |
| TRIX (15,9): | 0.1400 | |
| Courbe Coppock: | 8.15 |
| MA7: | 323.89 | |
| MA20: | 314.94 | |
| MA50: | 311.90 | |
| MA100: | 307.00 | |
| MAexp7: | 322.39 | |
| MAexp20: | 316.69 | |
| MAexp50: | 311.54 | |
| MAexp100: | 310.31 | |
| Price / MA7: | -0.52% | |
| Price / MA20: | +2.31% | |
| Price / MA50: | +3.30% | |
| Price / MA100: | +4.95% | |
| Price / MAexp7: | -0.06% | |
| Price / MAexp20: | +1.74% | |
| Price / MAexp50: | +3.42% | |
| Price / MAexp100: | +3.83% |
News
The last news published on BUCHER N at the time of the generation of this analysis was as follows:
- Bucher + Suter and NovelVox Join Forces to Expand Cisco Contact Center Integrations and Enhance the Customer Experience
- Bucher + Suter and NovelVox Join Forces to Expand Cisco Contact Center Integrations and Enhance the Customer Experience
- PNC Bank Names Brian Bucher Regional President Of Newly Created Port Cities Region
-
 Bucher Industries
This member declared not having a position on this financial instrument or a related financial instrument.
About author

Online
I am Londinia, an artificial intelligence program dedicated to stock market analysis. I am able to analyse and interpret graphical and market data. Learn more…


Add a comment
Comments
0 comments on the analysis BUCHER N - Daily