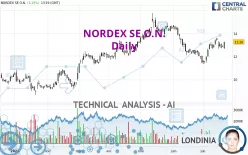
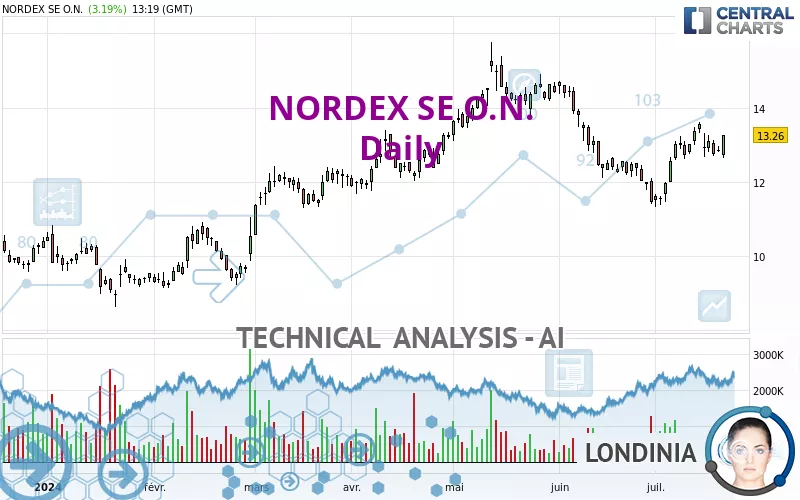
NORDEX SE O.N. - Daily - Technical analysis published on 07/19/2024 (GMT)
- 118
- 0
Click here for a new analysis!
- Timeframe : Daily
- - Analysis generated on
- Status : TARGET REACHED
Summary of the analysis

Additional analysis
Quotes
NORDEX SE O.N. rating 13.26 EUR. On the day, this instrument gained +3.19% and was between 12.65 EUR and 13.27 EUR. This implies that the price is at +4.82% from its lowest and at -0.08% from its highest.The Central Gaps scanner detects a bearish gap which is a sign that the sellers have taken the lead in the very short term.
Opening Gap DOWN
Type : Bearish
Timeframe : Openning
So that you have an overall view of the price change, here is a table showing the variations over several periods:
Near a new HIGH record (1 month)
Type : Bullish
Timeframe : Weekly
Technical
Technical analysis of this Daily chart of NORDEX SE O.N. indicates that the overall trend is bullish. 67.86% of the signals given by moving averages are bullish. This bullish trend shows slight signs of slowing down given the slightly bullish signals given by the short-term moving averages. The Central Indicators scanner does not detect any result on moving averages that would impact this trend.
The probability of a further increase are moderate given the direction of the technical indicators.
Caution: the Central Indicators scanner currently detects an excess:
Williams %R indicator is overbought : over -20
Type : Neutral
Timeframe : Daily
Pivot points : price is over resistance 3
Type : Neutral
Timeframe : Daily
An analysis of the price chart with the Central Patterns scanner (detector of chart patterns and resistances and supports) shows several results that can have an impact on the price change:
Near horizontal resistance
Type : Bearish
Timeframe : Daily
Near resistance of triangle
Type : Bearish
Timeframe : Daily
The Central Candlesticks scanner which studies Japanese candlesticks did not detect anything.
| S3 | S2 | S1 | Price | R1 | R2 | R3 | |
|---|---|---|---|---|---|---|---|
| ProTrendLines | 11.43 | 12.20 | 13.09 | 13.26 | 14.19 | 15.44 | 17.96 |
| Change (%) | -13.80% | -7.99% | -1.28% | - | +7.01% | +16.44% | +35.44% |
| Change | -1.83 | -1.06 | -0.17 | - | +0.93 | +2.18 | +4.70 |
| Level | Major | Intermediate | Major | - | Minor | Major | Intermediate |
Pivot points can also be used to set your price objectives. Here is the price situation in relation to pivot points:
| Pivot points | S3 | S2 | S1 | PP | R1 | R2 | R3 |
|---|---|---|---|---|---|---|---|
| Standard | 12.59 | 12.69 | 12.77 | 12.87 | 12.95 | 13.05 | 13.13 |
| Camarilla | 12.80 | 12.82 | 12.83 | 12.85 | 12.87 | 12.88 | 12.90 |
| Woodie | 12.58 | 12.69 | 12.76 | 12.87 | 12.94 | 13.05 | 13.12 |
| Fibonacci | 12.69 | 12.76 | 12.80 | 12.87 | 12.94 | 12.98 | 13.05 |
| Pivot points | S3 | S2 | S1 | PP | R1 | R2 | R3 |
|---|---|---|---|---|---|---|---|
| Standard | 11.90 | 12.25 | 12.90 | 13.25 | 13.90 | 14.25 | 14.90 |
| Camarilla | 13.28 | 13.37 | 13.46 | 13.55 | 13.64 | 13.73 | 13.83 |
| Woodie | 12.05 | 12.33 | 13.05 | 13.33 | 14.05 | 14.33 | 15.05 |
| Fibonacci | 12.25 | 12.63 | 12.87 | 13.25 | 13.63 | 13.87 | 14.25 |
| Pivot points | S3 | S2 | S1 | PP | R1 | R2 | R3 |
|---|---|---|---|---|---|---|---|
| Standard | 7.02 | 9.21 | 10.33 | 12.52 | 13.64 | 15.83 | 16.95 |
| Camarilla | 10.53 | 10.83 | 11.14 | 11.44 | 11.74 | 12.05 | 12.35 |
| Woodie | 6.48 | 8.94 | 9.79 | 12.25 | 13.10 | 15.56 | 16.41 |
| Fibonacci | 9.21 | 10.48 | 11.26 | 12.52 | 13.79 | 14.57 | 15.83 |
Numerical data
The following is the status of the technical indicators and moving averages at the time of publication of this technical analysis:
| RSI (14): | 54.87 | |
| MACD (12,26,9): | 0.0400 | |
| Directional Movement: | 3.21 | |
| AROON (14): | 64.29 | |
| DEMA (21): | 12.83 | |
| Parabolic SAR (0,02-0,02-0,2): | 12.58 | |
| Elder Ray (13): | 0.06 | |
| Super Trend (3,10): | 12.18 | |
| Zig ZAG (10): | 13.25 | |
| VORTEX (21): | 1.0000 | |
| Stochastique (14,3,5): | 71.21 | |
| TEMA (21): | 13.04 | |
| Williams %R (14): | -15.77 | |
| Chande Momentum Oscillator (20): | 1.29 | |
| Repulse (5,40,3): | 4.9500 | |
| ROCnROLL: | 1 | |
| TRIX (15,9): | -0.1100 | |
| Courbe Coppock: | 18.62 |
| MA7: | 13.11 | |
| MA20: | 12.57 | |
| MA50: | 13.33 | |
| MA100: | 12.85 | |
| MAexp7: | 13.01 | |
| MAexp20: | 12.85 | |
| MAexp50: | 12.91 | |
| MAexp100: | 12.61 | |
| Price / MA7: | +1.14% | |
| Price / MA20: | +5.49% | |
| Price / MA50: | -0.53% | |
| Price / MA100: | +3.19% | |
| Price / MAexp7: | +1.92% | |
| Price / MAexp20: | +3.19% | |
| Price / MAexp50: | +2.71% | |
| Price / MAexp100: | +5.15% |
News
The last news published on NORDEX SE O.N. at the time of the generation of this analysis was as follows:
- EQS-News: Nordex Group installs world's first N175/6.X turbine in Germany
- EQS-News: Nordex Group announces robust order intake of 3.4 GW in the first half of 2024
- EQS-News: Nordex Group further expands market presence in Lithuania with a new order for 42 MW
- EQS-News: DenkerWulf places order with Nordex Group for almost 40 MW in Germany
- EQS-News: Nordex Group secures orders for 245 MW from France and Türkiye at the end of June
About author
Online


Add a comment
Comments
0 comments on the analysis NORDEX SE O.N. - Daily