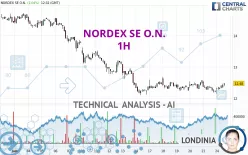
NORDEX SE O.N. - 1H - Technical analysis published on 06/24/2024 (GMT)
- 115
- 0
Click here for a new analysis!
- Timeframe : 1H
- - Analysis generated on
- Status : TARGET REACHED

Summary of the analysis

Additional analysis
Quotes
The NORDEX SE O.N. rating is 12.42 EUR. The price has increased by +1.55% since the last closing and was traded between 12.14 EUR and 12.47 EUR over the period. The price is currently at +2.31% from its lowest and -0.40% from its highest.A bullish opening was detected by the Central Gaps scanner. Buyers are trying to impose a bullish momentum in the very short term.
Bullish opening
Type : Bullish
Timeframe : Openning
Here is a more detailed summary of the historical variations registered by NORDEX SE O.N.:
Near a new LOW record (1 month)
Type : Bearish
Timeframe : Weekly
Technical
A technical analysis in 1H of this NORDEX SE O.N. chart shows a bearish trend. 64.29% of the signals given by moving averages are bearish. Caution: the slightly bullish signals currently given by short-term moving averages show a possible weakening of the global trend. An assessment of moving averages reveals several bearish signals that could impact this trend:
Bearish price crossover with adaptative moving average 50
Type : Bearish
Timeframe : 1 hour
Bearish price crossover with adaptative moving average 100
Type : Bearish
Timeframe : 1 hour
In fact, 11 technical indicators on 18 studied are currently bullish. Central Indicators, the detector scanner for these technical indicators has recently detected several signals:
Ichimoku : price is under the cloud
Type : Bearish
Timeframe : 1 hour
Price is back over the pivot point
Type : Bullish
Timeframe : Weekly
The Central Patterns scanner, which studies chart patterns, resistances and supports, has identified this signal:
Resistance of channel is broken
Type : Bullish
Timeframe : 1 hour
The Central Candlesticks scanner which studies Japanese candlesticks did not detect anything.
| S3 | S2 | S1 | Price | R1 | R2 | R3 | |
|---|---|---|---|---|---|---|---|
| ProTrendLines | 9.58 | 10.42 | 12.20 | 12.42 | 12.57 | 13.09 | 13.51 |
| Change (%) | -22.87% | -16.10% | -1.77% | - | +1.21% | +5.39% | +8.78% |
| Change | -2.84 | -2.00 | -0.22 | - | +0.15 | +0.67 | +1.09 |
| Level | Minor | Major | Intermediate | - | Intermediate | Major | Minor |
To determine price objectives, it is also possible to use the pivot points. Here is the price position in relation to pivot points:
| Pivot points | S3 | S2 | S1 | PP | R1 | R2 | R3 |
|---|---|---|---|---|---|---|---|
| Standard | 11.72 | 11.95 | 12.09 | 12.32 | 12.46 | 12.69 | 12.83 |
| Camarilla | 12.13 | 12.16 | 12.20 | 12.23 | 12.26 | 12.30 | 12.33 |
| Woodie | 11.68 | 11.93 | 12.05 | 12.30 | 12.42 | 12.67 | 12.79 |
| Fibonacci | 11.95 | 12.09 | 12.18 | 12.32 | 12.46 | 12.55 | 12.69 |
| Pivot points | S3 | S2 | S1 | PP | R1 | R2 | R3 |
|---|---|---|---|---|---|---|---|
| Standard | 11.55 | 11.86 | 12.05 | 12.36 | 12.55 | 12.86 | 13.05 |
| Camarilla | 12.09 | 12.14 | 12.18 | 12.23 | 12.28 | 12.32 | 12.37 |
| Woodie | 11.48 | 11.83 | 11.98 | 12.33 | 12.48 | 12.83 | 12.98 |
| Fibonacci | 11.86 | 12.05 | 12.17 | 12.36 | 12.55 | 12.67 | 12.86 |
| Pivot points | S3 | S2 | S1 | PP | R1 | R2 | R3 |
|---|---|---|---|---|---|---|---|
| Standard | 10.44 | 11.77 | 13.10 | 14.43 | 15.76 | 17.09 | 18.42 |
| Camarilla | 13.69 | 13.93 | 14.18 | 14.42 | 14.66 | 14.91 | 15.15 |
| Woodie | 10.43 | 11.77 | 13.09 | 14.43 | 15.75 | 17.09 | 18.41 |
| Fibonacci | 11.77 | 12.79 | 13.42 | 14.43 | 15.45 | 16.08 | 17.09 |
Numerical data
The following is the status of the technical indicators and moving averages at the time of publication of this technical analysis:
| RSI (14): | 52.09 | |
| MACD (12,26,9): | -0.0100 | |
| Directional Movement: | 4.62 | |
| AROON (14): | -64.29 | |
| DEMA (21): | 12.34 | |
| Parabolic SAR (0,02-0,02-0,2): | 12.15 | |
| Elder Ray (13): | 0.06 | |
| Super Trend (3,10): | 12.52 | |
| Zig ZAG (10): | 12.41 | |
| VORTEX (21): | 0.9900 | |
| Stochastique (14,3,5): | 70.77 | |
| TEMA (21): | 12.37 | |
| Williams %R (14): | -15.15 | |
| Chande Momentum Oscillator (20): | 0.13 | |
| Repulse (5,40,3): | 0.8000 | |
| ROCnROLL: | -1 | |
| TRIX (15,9): | -0.0200 | |
| Courbe Coppock: | 1.10 |
| MA7: | 12.40 | |
| MA20: | 13.39 | |
| MA50: | 13.52 | |
| MA100: | 12.33 | |
| MAexp7: | 12.38 | |
| MAexp20: | 12.36 | |
| MAexp50: | 12.45 | |
| MAexp100: | 12.76 | |
| Price / MA7: | +0.16% | |
| Price / MA20: | -7.24% | |
| Price / MA50: | -8.14% | |
| Price / MA100: | +0.73% | |
| Price / MAexp7: | +0.32% | |
| Price / MAexp20: | +0.49% | |
| Price / MAexp50: | -0.24% | |
| Price / MAexp100: | -2.66% |
News
The last news published on NORDEX SE O.N. at the time of the generation of this analysis was as follows:
- EQS-News: Nordex Group receives orders for 172 MW in Germany
- EQS-News: Nordex exceeds 5 GW threshold for installations in the Nordics
- EQS-News: Nordex Group starts the year with solid sales growth and an EBITDA margin of 3.3%; Full year guidance confirmed
- EQS-News: USA: Nordex Group receives order for 148 MW for N149/5.X turbines
- EQS-News: Nordex Group appoints new CEO for the Division North America to strengthen US business
About author
Online


Add a comment
Comments
0 comments on the analysis NORDEX SE O.N. - 1H