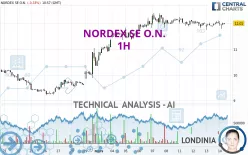
NORDEX SE O.N. - 1H - Technical analysis published on 03/14/2024 (GMT)
- 105
- 0
Click here for a new analysis!
- Timeframe : 1H
- - Analysis generated on
- Status : INVALID
Summary of the analysis

Additional analysis
Quotes
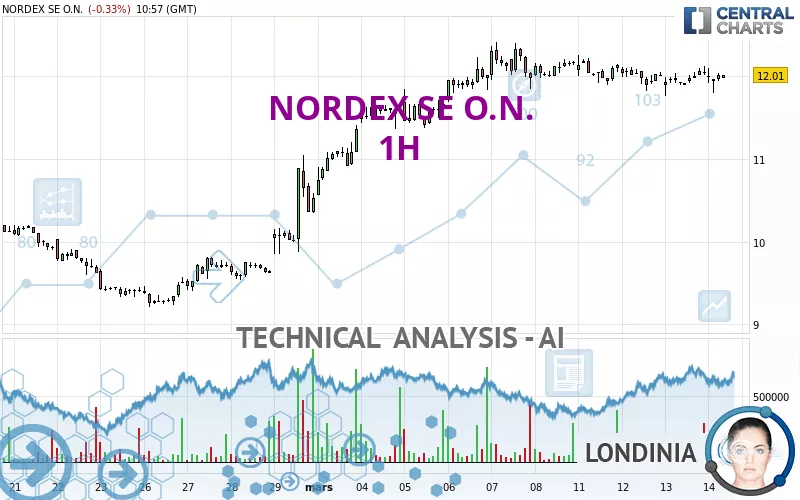
The NORDEX SE O.N. price is 12.015 EUR. On the day, this instrument lost -0.29% and was between 11.800 EUR and 12.095 EUR. This implies that the price is at +1.82% from its lowest and at -0.66% from its highest.The Central Gaps scanner detects a bearish opening. A small advantage for sellers in the very short term.
Bearish opening
Type : Bearish
Timeframe : Openning
Here is a more detailed summary of the historical variations registered by NORDEX SE O.N.:
Near a new HIGH record (1st january)
Type : Bullish
Timeframe : Weekly
Near a new HIGH record (1 month)
Type : Bullish
Timeframe : Weekly
Technical
Technical analysis of NORDEX SE O.N. in 1H shows an overall bullish trend. The signals given by moving averages are 71.43% bullish. This bullish trend is slowing down slightly given the slightly bullish signals of short-term moving averages. The Central Indicators market scanner is currently detecting several bearish and bullish signals that could impact this trend:
Bearish trend reversal : adaptative moving average 20
Type : Bearish
Timeframe : 1 hour
Bullish price crossover with adaptative moving average 20
Type : Bullish
Timeframe : 1 hour
In fact, only 8 technical indicators out of 18 studied are currently bullish. Caution: the Central Indicators scanner currently detects an excess:
CCI indicator: bullish divergence
Type : Bullish
Timeframe : 1 hour
MACD indicator: bullish divergence
Type : Bullish
Timeframe : 1 hour
Price is back over the pivot point
Type : Bullish
Timeframe : 1 hour
The Central Patterns scanner, which studies chart patterns, resistances and supports, has identified these signals:
Near horizontal resistance
Type : Bearish
Timeframe : 1 hour
Near resistance of channel
Type : Bearish
Timeframe : 1 hour
No result was found by the Central Candlesticks scanner on Japanese candlesticks.
| S3 | S2 | S1 | Price | R1 | R2 | R3 | |
|---|---|---|---|---|---|---|---|
| ProTrendLines | 10.419 | 10.903 | 11.997 | 12.015 | 12.413 | 13.093 | 15.437 |
| Change (%) | -13.28% | -9.26% | -0.15% | - | +3.31% | +8.97% | +28.48% |
| Change | -1.596 | -1.112 | -0.018 | - | +0.398 | +1.078 | +3.422 |
| Level | Major | Minor | Intermediate | - | Intermediate | Major | Intermediate |
Attention could also be paid to pivot points to set price objectives:
| Pivot points | S3 | S2 | S1 | PP | R1 | R2 | R3 |
|---|---|---|---|---|---|---|---|
| Standard | 11.473 | 11.617 | 11.833 | 11.977 | 12.193 | 12.337 | 12.553 |
| Camarilla | 11.951 | 11.984 | 12.017 | 12.050 | 12.083 | 12.116 | 12.149 |
| Woodie | 11.510 | 11.635 | 11.870 | 11.995 | 12.230 | 12.355 | 12.590 |
| Fibonacci | 11.617 | 11.754 | 11.839 | 11.977 | 12.114 | 12.199 | 12.337 |
| Pivot points | S3 | S2 | S1 | PP | R1 | R2 | R3 |
|---|---|---|---|---|---|---|---|
| Standard | 10.493 | 10.927 | 11.548 | 11.982 | 12.603 | 13.037 | 13.658 |
| Camarilla | 11.880 | 11.977 | 12.073 | 12.170 | 12.267 | 12.363 | 12.460 |
| Woodie | 10.588 | 10.974 | 11.643 | 12.029 | 12.698 | 13.084 | 13.753 |
| Fibonacci | 10.927 | 11.330 | 11.579 | 11.982 | 12.385 | 12.634 | 13.037 |
| Pivot points | S3 | S2 | S1 | PP | R1 | R2 | R3 |
|---|---|---|---|---|---|---|---|
| Standard | 7.500 | 8.315 | 9.420 | 10.235 | 11.340 | 12.155 | 13.260 |
| Camarilla | 9.997 | 10.173 | 10.349 | 10.525 | 10.701 | 10.877 | 11.053 |
| Woodie | 7.645 | 8.388 | 9.565 | 10.308 | 11.485 | 12.228 | 13.405 |
| Fibonacci | 8.315 | 9.048 | 9.502 | 10.235 | 10.968 | 11.422 | 12.155 |
Numerical data
The following are the details of the technical indicators and moving averages that were collected to generate this technical analysis:
| RSI (14): | 50.53 | |
| MACD (12,26,9): | -0.0040 | |
| Directional Movement: | -7.476 | |
| AROON (14): | 57.142 | |
| DEMA (21): | 11.989 | |
| Parabolic SAR (0,02-0,02-0,2): | 12.114 | |
| Elder Ray (13): | 0 | |
| Super Trend (3,10): | 11.766 | |
| Zig ZAG (10): | 12.000 | |
| VORTEX (21): | 0.9010 | |
| Stochastique (14,3,5): | 59.72 | |
| TEMA (21): | 11.953 | |
| Williams %R (14): | -38.89 | |
| Chande Momentum Oscillator (20): | -0.020 | |
| Repulse (5,40,3): | 0.3440 | |
| ROCnROLL: | -1 | |
| TRIX (15,9): | -0.0180 | |
| Courbe Coppock: | 0.06 |
| MA7: | 12.047 | |
| MA20: | 10.920 | |
| MA50: | 10.179 | |
| MA100: | 10.193 | |
| MAexp7: | 11.985 | |
| MAexp20: | 11.994 | |
| MAexp50: | 11.906 | |
| MAexp100: | 11.544 | |
| Price / MA7: | -0.27% | |
| Price / MA20: | +10.03% | |
| Price / MA50: | +18.04% | |
| Price / MA100: | +17.88% | |
| Price / MAexp7: | +0.25% | |
| Price / MAexp20: | +0.18% | |
| Price / MAexp50: | +0.92% | |
| Price / MAexp100: | +4.08% |
News
The last news published on NORDEX SE O.N. at the time of the generation of this analysis was as follows:
- EQS-News: Nordex Group increases consolidated sales in 2023 to EUR 6.5 billion and achieves positive operating result
- EQS-News: Nordex Group: preliminary annual figures for 2023 confirm guidance
- EQS-News: Nordex Group achieves order intake of 7.4 GW in the fiscal year 2023
- EQS-News: Nordex Group scores highly in Germany for 2023 in terms of incoming orders and auction rounds
- EQS-News: Nordex Group receives orders for 122 MW from Denker & Wulf AG in Germany
About author
Online


Add a comment
Comments
0 comments on the analysis NORDEX SE O.N. - 1H