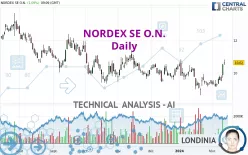
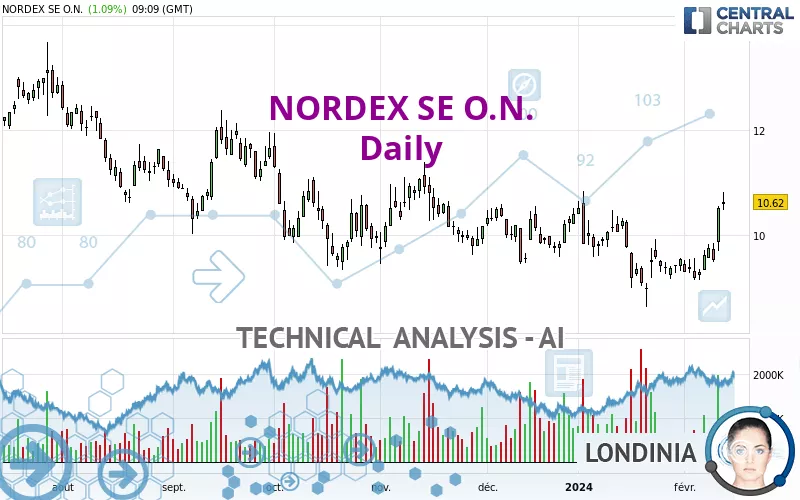
NORDEX SE O.N. - Daily - Technical analysis published on 02/13/2024 (GMT)
- 153
- 0
Click here for a new analysis!
- Timeframe : Daily
- - Analysis generated on
- Status : INVALID
Summary of the analysis

Additional analysis
Quotes
The NORDEX SE O.N. rating is 10.620 EUR. On the day, this instrument gained +1.10% with the lowest point at 10.460 EUR and the highest point at 10.810 EUR. The deviation from the price is +1.53% for the low point and -1.76% for the high point.A bullish gap was detected at the opening by the Central Gaps scanner. There are a lot of buyers and they have the upper hand in the very short term.
Opening Gap UP
Type : Bullish
Timeframe : Openning
Here is a more detailed summary of the historical variations registered by NORDEX SE O.N.:
Near a new HIGH record (1st january)
Type : Bullish
Timeframe : Weekly
New HIGH record (1 month)
Type : Bullish
Timeframe : Weekly
Technical
Technical analysis of this Daily chart of NORDEX SE O.N. indicates that the overall trend is slightly bullish. 60.71% of the signals given by moving averages are bullish. The overall trend could accelerate as strong bullish signals from short-term moving averages are expected. The Central Indicators scanner detects bullish signals on moving averages that could impact this trend:
Bullish trend reversal : Moving Average 20
Type : Bullish
Timeframe : Daily
Bullish trend reversal : Moving Average 50
Type : Bullish
Timeframe : Daily
Bullish trend reversal : adaptative moving average 50
Type : Bullish
Timeframe : Daily
Bullish trend reversal : adaptative moving average 100
Type : Bullish
Timeframe : Daily
Technical indicators are strongly bullish, suggesting that the price increase should continue.
But beware of excesses. The Central Indicators scanner currently detects this:
CCI indicator is overbought : over 100
Type : Neutral
Timeframe : Daily
Previous candle closed over Bollinger bands
Type : Neutral
Timeframe : Daily
Williams %R indicator is overbought : over -20
Type : Neutral
Timeframe : Daily
Pivot points : price is over resistance 2
Type : Neutral
Timeframe : Weekly
MACD indicator is back over 0
Type : Bullish
Timeframe : Daily
An analysis of the price chart with the Central Patterns scanner (detector of chart patterns and resistances and supports) shows a result that can have an impact on the price change:
Near horizontal resistance
Type : Bearish
Timeframe : Daily
The Central Candlesticks scanner which studies Japanese candlesticks did not detect anything.
| S3 | S2 | S1 | Price | R1 | R2 | R3 | |
|---|---|---|---|---|---|---|---|
| ProTrendLines | 8.976 | 9.568 | 10.408 | 10.620 | 11.069 | 11.997 | 13.093 |
| Change (%) | -15.48% | -9.91% | -2.00% | - | +4.23% | +12.97% | +23.29% |
| Change | -1.644 | -1.052 | -0.212 | - | +0.449 | +1.377 | +2.473 |
| Level | Minor | Major | Major | - | Minor | Minor | Intermediate |
Pivot points can also be used to set your price objectives. Here is the price situation in relation to pivot points:
| Pivot points | S3 | S2 | S1 | PP | R1 | R2 | R3 |
|---|---|---|---|---|---|---|---|
| Standard | 9.087 | 9.382 | 9.944 | 10.239 | 10.801 | 11.096 | 11.658 |
| Camarilla | 10.269 | 10.348 | 10.426 | 10.505 | 10.584 | 10.662 | 10.741 |
| Woodie | 9.220 | 9.449 | 10.077 | 10.306 | 10.934 | 11.163 | 11.791 |
| Fibonacci | 9.382 | 9.710 | 9.912 | 10.239 | 10.567 | 10.769 | 11.096 |
| Pivot points | S3 | S2 | S1 | PP | R1 | R2 | R3 |
|---|---|---|---|---|---|---|---|
| Standard | 8.433 | 8.781 | 9.143 | 9.491 | 9.853 | 10.201 | 10.563 |
| Camarilla | 9.309 | 9.374 | 9.439 | 9.504 | 9.569 | 9.634 | 9.699 |
| Woodie | 8.439 | 8.785 | 9.149 | 9.495 | 9.859 | 10.205 | 10.569 |
| Fibonacci | 8.781 | 9.053 | 9.220 | 9.491 | 9.763 | 9.930 | 10.201 |
| Pivot points | S3 | S2 | S1 | PP | R1 | R2 | R3 |
|---|---|---|---|---|---|---|---|
| Standard | 6.277 | 7.447 | 8.486 | 9.656 | 10.695 | 11.865 | 12.904 |
| Camarilla | 8.919 | 9.121 | 9.324 | 9.526 | 9.729 | 9.931 | 10.134 |
| Woodie | 6.213 | 7.414 | 8.422 | 9.623 | 10.631 | 11.832 | 12.840 |
| Fibonacci | 7.447 | 8.291 | 8.812 | 9.656 | 10.500 | 11.021 | 11.865 |
Numerical data
The following is the status of the technical indicators and moving averages at the time of publication of this technical analysis:
| RSI (14): | 65.21 | |
| MACD (12,26,9): | 0.0760 | |
| Directional Movement: | 17.431 | |
| AROON (14): | 42.857 | |
| DEMA (21): | 9.714 | |
| Parabolic SAR (0,02-0,02-0,2): | 8.897 | |
| Elder Ray (13): | 0.867 | |
| Super Trend (3,10): | 9.436 | |
| Zig ZAG (10): | 10.645 | |
| VORTEX (21): | 0.9880 | |
| Stochastique (14,3,5): | 75.84 | |
| TEMA (21): | 9.897 | |
| Williams %R (14): | -9.82 | |
| Chande Momentum Oscillator (20): | 1.138 | |
| Repulse (5,40,3): | 6.0220 | |
| ROCnROLL: | 1 | |
| TRIX (15,9): | -0.1350 | |
| Courbe Coppock: | 9.54 |
| MA7: | 9.767 | |
| MA20: | 9.487 | |
| MA50: | 9.816 | |
| MA100: | 10.124 | |
| MAexp7: | 9.961 | |
| MAexp20: | 9.694 | |
| MAexp50: | 9.825 | |
| MAexp100: | 10.177 | |
| Price / MA7: | +8.73% | |
| Price / MA20: | +11.94% | |
| Price / MA50: | +8.19% | |
| Price / MA100: | +4.90% | |
| Price / MAexp7: | +6.62% | |
| Price / MAexp20: | +9.55% | |
| Price / MAexp50: | +8.09% | |
| Price / MAexp100: | +4.35% |
News
The last news published on NORDEX SE O.N. at the time of the generation of this analysis was as follows:
- EQS-News: Nordex Group: preliminary annual figures for 2023 confirm guidance
- EQS-News: Nordex Group achieves order intake of 7.4 GW in the fiscal year 2023
- EQS-News: Nordex Group scores highly in Germany for 2023 in terms of incoming orders and auction rounds
- EQS-News: Nordex Group receives orders for 122 MW from Denker & Wulf AG in Germany
- EQS-News: Nordex Group receives orders for 197 MW from UKA in Germany
About author
Online


Add a comment
Comments
0 comments on the analysis NORDEX SE O.N. - Daily