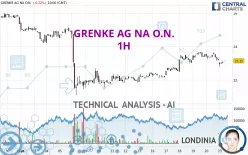
GRENKE AG NA O.N. - 1H - Technical analysis published on 09/23/2024 (GMT)
- 129
- 0
- Timeframe : 1H
- - Analysis generated on
- Status : NEUTRAL

Summary of the analysis

Additional analysis
Quotes
GRENKE AG NA O.N. rating 23.15 EUR. On the day, this instrument lost -0.22% and was between 22.80 EUR and 23.15 EUR. This implies that the price is at +1.54% from its lowest and at 0% from its highest.A bearish gap was detected at the opening by the Central Gaps scanner. There are a lot of sellers and they have the upper hand in the very short term.
Opening Gap DOWN
Type : Bearish
Timeframe : Openning
Here is a more detailed summary of the historical variations registered by GRENKE AG NA O.N.:
Abnormal volumes
Timeframe : 20 days
Technical
Technical analysis of GRENKE AG NA O.N. in 1H shows an overall slightly bullish trend. 53.57% of the signals given by moving averages are bullish. As the signals currently given by short-term moving averages are rather neutral, the slightly bullish trend could return to neutral. The Central Indicators market scanner is currently detecting a bullish signal that could impact this trend:
Bullish trend reversal : adaptative moving average 50
Type : Bullish
Timeframe : 1 hour
The technical indicators are generally neutral. They do not provide relevant information on the direction of future price movements.
But beware of excesses. The Central Indicators scanner currently detects this:
CCI indicator is oversold : under -100
Type : Neutral
Timeframe : 1 hour
The Central Patterns scanner, which studies chart patterns, resistances and supports, has identified these signals:
Near horizontal support
Type : Bullish
Timeframe : 1 hour
Near support of channel
Type : Bullish
Timeframe : 1 hour
The presence of these Japanese chandelier patterns detected by Central Candlesticks that could impact the current short-term trend were also noted:
Bearish doji star
Type : Bearish
Timeframe : 1 hour
Doji
Type : Neutral
Timeframe : 1 hour
| S3 | S2 | S1 | Price | R1 | R2 | R3 | |
|---|---|---|---|---|---|---|---|
| ProTrendLines | 21.00 | 22.11 | 23.00 | 23.15 | 23.65 | 24.20 | 24.80 |
| Change (%) | -9.29% | -4.49% | -0.65% | - | +2.16% | +4.54% | +7.13% |
| Change | -2.15 | -1.04 | -0.15 | - | +0.50 | +1.05 | +1.65 |
| Level | Intermediate | Major | Intermediate | - | Intermediate | Minor | Intermediate |
Pivot points can also be used to set your price objectives. Here is the price situation in relation to pivot points:
| Pivot points | S3 | S2 | S1 | PP | R1 | R2 | R3 |
|---|---|---|---|---|---|---|---|
| Standard | 22.52 | 22.83 | 23.02 | 23.33 | 23.52 | 23.83 | 24.02 |
| Camarilla | 23.06 | 23.11 | 23.15 | 23.20 | 23.25 | 23.29 | 23.34 |
| Woodie | 22.45 | 22.80 | 22.95 | 23.30 | 23.45 | 23.80 | 23.95 |
| Fibonacci | 22.83 | 23.02 | 23.14 | 23.33 | 23.52 | 23.64 | 23.83 |
| Pivot points | S3 | S2 | S1 | PP | R1 | R2 | R3 |
|---|---|---|---|---|---|---|---|
| Standard | 20.85 | 21.50 | 22.35 | 23.00 | 23.85 | 24.50 | 25.35 |
| Camarilla | 22.79 | 22.93 | 23.06 | 23.20 | 23.34 | 23.48 | 23.61 |
| Woodie | 20.95 | 21.55 | 22.45 | 23.05 | 23.95 | 24.55 | 25.45 |
| Fibonacci | 21.50 | 22.07 | 22.43 | 23.00 | 23.57 | 23.93 | 24.50 |
| Pivot points | S3 | S2 | S1 | PP | R1 | R2 | R3 |
|---|---|---|---|---|---|---|---|
| Standard | 19.53 | 22.02 | 23.68 | 26.17 | 27.83 | 30.32 | 31.98 |
| Camarilla | 24.21 | 24.59 | 24.97 | 25.35 | 25.73 | 26.11 | 26.49 |
| Woodie | 19.13 | 21.81 | 23.28 | 25.96 | 27.43 | 30.11 | 31.58 |
| Fibonacci | 22.02 | 23.60 | 24.58 | 26.17 | 27.75 | 28.73 | 30.32 |
Numerical data
The following are the details of the technical indicators and moving averages that were collected to generate this technical analysis:
| RSI (14): | 47.90 | |
| MACD (12,26,9): | 0.0100 | |
| Directional Movement: | -6.26 | |
| AROON (14): | -28.57 | |
| DEMA (21): | 23.30 | |
| Parabolic SAR (0,02-0,02-0,2): | 23.53 | |
| Elder Ray (13): | -0.08 | |
| Super Trend (3,10): | 23.47 | |
| Zig ZAG (10): | 23.15 | |
| VORTEX (21): | 0.9200 | |
| Stochastique (14,3,5): | 35.29 | |
| TEMA (21): | 23.16 | |
| Williams %R (14): | -58.82 | |
| Chande Momentum Oscillator (20): | -0.30 | |
| Repulse (5,40,3): | 0.2900 | |
| ROCnROLL: | -1 | |
| TRIX (15,9): | 0.0600 | |
| Courbe Coppock: | 2.52 |
| MA7: | 22.89 | |
| MA20: | 23.61 | |
| MA50: | 25.68 | |
| MA100: | 23.86 | |
| MAexp7: | 23.17 | |
| MAexp20: | 23.24 | |
| MAexp50: | 23.08 | |
| MAexp100: | 23.16 | |
| Price / MA7: | +1.14% | |
| Price / MA20: | -1.95% | |
| Price / MA50: | -9.85% | |
| Price / MA100: | -2.98% | |
| Price / MAexp7: | -0.09% | |
| Price / MAexp20: | -0.39% | |
| Price / MAexp50: | +0.30% | |
| Price / MAexp100: | -0.04% |
News
The latest news and videos published on GRENKE AG NA O.N. at the time of the analysis were as follows:
- EQS-News: Changes in the Board of Directors
- EQS-News: grenke increases Group earnings and improves cost-income ratio in the first half of 2024
- EQS-News: With 21.5 % quarterly growth, grenke achieves key milestone on path to target of over EUR 3 bn
- EQS-News: Dr Martin Paal starts as the new Chief Financial Officer of grenke AG
- EQS-News: GRENKE STARTS YEAR WITH STRONG Q1 2024
About author
Online


Add a comment
Comments
0 comments on the analysis GRENKE AG NA O.N. - 1H