PUMA SE - 15 min. - Technical analysis published on 01/30/2025 (GMT)
- 93
- 0
Click here for a new analysis!
- Timeframe : 15 min.
- - Analysis generated on
- Status : LEVEL MAINTAINED
Summary of the analysis

Additional analysis
Quotes
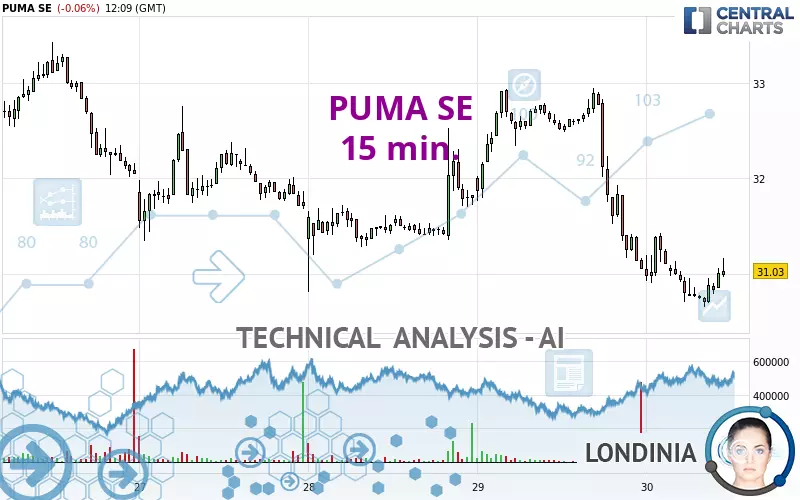
The PUMA SE price is 31.03 EUR. The price is lower by -0.06% since the last closing with the lowest point at 30.65 EUR and the highest point at 31.43 EUR. The deviation from the price is +1.24% for the low point and -1.27% for the high point.A study of price movements over other periods shows the following variations:
New LOW record (5 years)
Type : Bearish
Timeframe : Weekly
New LOW record (1 year)
Type : Bearish
Timeframe : Weekly
New LOW record (1st january)
Type : Bearish
Timeframe : Weekly
New LOW record (1 month)
Type : Bearish
Timeframe : Weekly
Abnormal volumes on PUMA SE were detected by the Central Volumes scanner:
Abnormal volumes
Timeframe : 5 days
Technical
Technical analysis of PUMA SE in 15 min. shows a overall strongly bearish trend. The signals given by moving averages are 89.29% bearish. This strong bearish trend is confirmed by the strong signals currently being given by short-term moving averages. The Central Indicators market scanner is currently detecting a bullish signal that could impact this trend:
Bullish price crossover with adaptative moving average 20
Type : Bullish
Timeframe : 15 minutes
In fact, of the 18 technical indicators analysed by Central Analyzer, 4 are bullish, 3 are neutral and 11 are bearish. Caution: the Central Indicators scanner currently detects an excess:
Williams %R indicator is oversold : under -80
Type : Neutral
Timeframe : 15 minutes
MACD crosses UP its Moving Average
Type : Bullish
Timeframe : 15 minutes
Central Patterns, the market scanner focusing on chart patterns, resistances and supports found these results:
Near horizontal support
Type : Bullish
Timeframe : 15 minutes
Near support of channel
Type : Bullish
Timeframe : 15 minutes
No result was found by the Central Candlesticks scanner on Japanese candlesticks.
| S3 | S2 | S1 | Price | R1 | R2 | R3 | |
|---|---|---|---|---|---|---|---|
| ProTrendLines | 13.71 | 26.03 | 30.81 | 31.03 | 32.94 | 34.92 | 40.96 |
| Change (%) | -55.82% | -16.11% | -0.71% | - | +6.16% | +12.54% | +32.00% |
| Change | -17.32 | -5.00 | -0.22 | - | +1.91 | +3.89 | +9.93 |
| Level | Minor | Intermediate | Intermediate | - | Minor | Major | Intermediate |
To determine price objectives, it is also possible to use the pivot points. Here is the price position in relation to pivot points:
| Pivot points | S3 | S2 | S1 | PP | R1 | R2 | R3 |
|---|---|---|---|---|---|---|---|
| Standard | 28.52 | 29.78 | 30.42 | 31.68 | 32.32 | 33.58 | 34.22 |
| Camarilla | 30.53 | 30.70 | 30.88 | 31.05 | 31.22 | 31.40 | 31.57 |
| Woodie | 28.20 | 29.63 | 30.10 | 31.53 | 32.00 | 33.43 | 33.90 |
| Fibonacci | 29.78 | 30.51 | 30.96 | 31.68 | 32.41 | 32.86 | 33.58 |
| Pivot points | S3 | S2 | S1 | PP | R1 | R2 | R3 |
|---|---|---|---|---|---|---|---|
| Standard | 18.82 | 25.40 | 28.73 | 35.31 | 38.64 | 45.22 | 48.55 |
| Camarilla | 29.33 | 30.23 | 31.14 | 32.05 | 32.96 | 33.87 | 34.78 |
| Woodie | 17.19 | 24.59 | 27.10 | 34.50 | 37.01 | 44.41 | 46.92 |
| Fibonacci | 25.40 | 29.19 | 31.53 | 35.31 | 39.10 | 41.44 | 45.22 |
| Pivot points | S3 | S2 | S1 | PP | R1 | R2 | R3 |
|---|---|---|---|---|---|---|---|
| Standard | 37.54 | 40.02 | 42.19 | 44.67 | 46.84 | 49.32 | 51.49 |
| Camarilla | 43.08 | 43.51 | 43.93 | 44.36 | 44.79 | 45.21 | 45.64 |
| Woodie | 37.39 | 39.94 | 42.04 | 44.59 | 46.69 | 49.24 | 51.34 |
| Fibonacci | 40.02 | 41.80 | 42.89 | 44.67 | 46.45 | 47.54 | 49.32 |
Numerical data
The following are the details of the technical indicators and moving averages that were collected to generate this technical analysis:
| RSI (14): | 28.12 | |
| MACD (12,26,9): | -0.3300 | |
| Directional Movement: | -23.85 | |
| AROON (14): | -42.86 | |
| DEMA (21): | 30.78 | |
| Parabolic SAR (0,02-0,02-0,2): | 30.95 | |
| Elder Ray (13): | -0.31 | |
| Super Trend (3,10): | 31.19 | |
| Zig ZAG (10): | 30.66 | |
| VORTEX (21): | 0.7100 | |
| Stochastique (14,3,5): | 5.36 | |
| TEMA (21): | 30.56 | |
| Williams %R (14): | -92.31 | |
| Chande Momentum Oscillator (20): | -0.24 | |
| Repulse (5,40,3): | -0.5600 | |
| ROCnROLL: | 2 | |
| TRIX (15,9): | -0.1600 | |
| Courbe Coppock: | 3.08 |
| MA7: | 33.08 | |
| MA20: | 38.99 | |
| MA50: | 42.67 | |
| MA100: | 41.16 | |
| MAexp7: | 30.87 | |
| MAexp20: | 31.22 | |
| MAexp50: | 31.63 | |
| MAexp100: | 32.10 | |
| Price / MA7: | -6.20% | |
| Price / MA20: | -20.42% | |
| Price / MA50: | -27.28% | |
| Price / MA100: | -24.61% | |
| Price / MAexp7: | +0.52% | |
| Price / MAexp20: | -0.61% | |
| Price / MAexp50: | -1.90% | |
| Price / MAexp100: | -3.33% |
News
The latest news and videos published on PUMA SE at the time of the analysis were as follows:
- EQS-News: PUMA accelerates growth throughout 2024 and initiates program to increase profitability
- EQS-Adhoc: PUMA SE: PUMA announces preliminary results for the fourth quarter and the full year 2024
- PUMA Recognized as Top Employer in 50 Countries
- PUMA Opens New Creative Hub Studio48 to Foster Excellence in Design and Elevate the Brand
- PUMA Partners With adam&eveDDB to Bring New Global Brand Strategy to Life
About author

Online


Add a comment
Comments
0 comments on the analysis PUMA SE - 15 min.