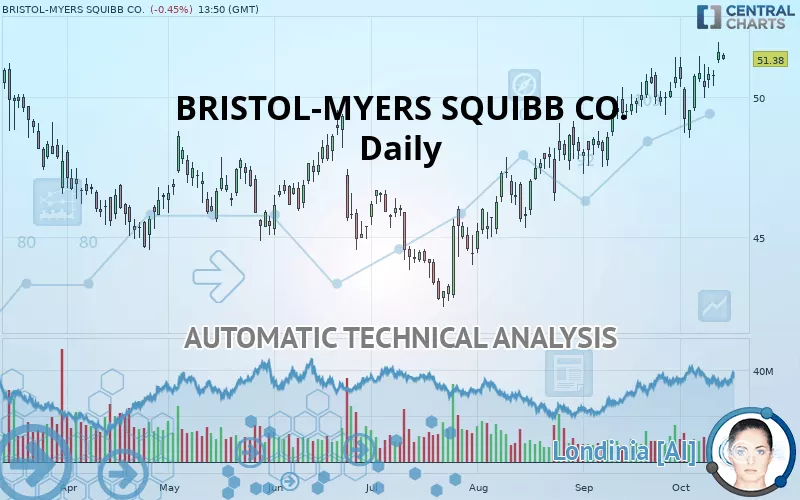
BRISTOL-MYERS SQUIBB CO. - Daily - Technical analysis published on 10/14/2019 (GMT)
- 376
- 0
- Who voted?
Click here for a new analysis!
- Timeframe : Daily
- - Analysis generated on
- Status : TARGET REACHED

Summary of the analysis

Additional analysis
Quotes
The BRISTOL-MYERS SQUIBB CO. price is 51.37 USD. The price registered a decrease of -0.47% on the session and was traded between 51.32 USD and 51.59 USD over the period. The price is currently at +0.10% from its lowest and -0.43% from its highest.A bearish opening was detected by the Central Gaps scanner. Sellers are trying to impose a bearish trend in the very short term.
Bearish opening
Type : Bearish
Timeframe : Openning
So that you have an overall view of the price change, here is a table showing the variations over several periods:
Near a new HIGH record (1st january)
Type : Bullish
Timeframe : Weekly
Near a new HIGH record (1 month)
Type : Bullish
Timeframe : Weekly
Technical
Technical analysis of this Daily chart of BRISTOL-MYERS SQUIBB CO. indicates that the overall trend is strongly bullish. The signals given by the moving averages are 92.86% bullish. This strong bullish trend is confirmed by the strong signals currently being given by short-term moving averages. There is no crossing of moving average by the price or crossing of moving averages between themselves.
The probability of a further increase are moderate given the direction of the technical indicators.
Caution: the Central Indicators scanner currently detects an excess:
CCI indicator is overbought : over 100
Type : Neutral
Timeframe : Daily
Williams %R indicator is overbought : over -20
Type : Neutral
Timeframe : Daily
Central Patterns, the market scanner focusing on chart patterns, resistances and supports found these results:
Near horizontal resistance
Type : Bearish
Timeframe : Daily
Resistance of channel is broken
Type : Bullish
Timeframe : Daily
The presence of a bullish Japanese candlestick pattern detected by Central Candlesticks that could cause a very short term rebound was also detected:
Upside gap
Type : Bullish
Timeframe : Daily
| S3 | S2 | S1 | Price | R1 | R2 | R3 | |
|---|---|---|---|---|---|---|---|
| ProTrendLines | 46.77 | 47.74 | 49.30 | 51.37 | 51.67 | 53.80 | 60.01 |
| Change (%) | -8.95% | -7.07% | -4.03% | - | +0.58% | +4.73% | +16.82% |
| Change | -4.60 | -3.63 | -2.07 | - | +0.30 | +2.43 | +8.64 |
| Level | Major | Intermediate | Major | - | Major | Major | Intermediate |
Attention could also be paid to pivot points to set price objectives:
| Pivot points | S3 | S2 | S1 | PP | R1 | R2 | R3 |
|---|---|---|---|---|---|---|---|
| Standard | 49.87 | 50.13 | 50.46 | 50.72 | 51.99 | 52.36 | 52.75 |
| Camarilla | 50.62 | 50.67 | 50.73 | 50.78 | 50.83 | 50.89 | 50.94 |
| Woodie | 50.47 | 50.15 | 50.49 | 50.74 | 51.08 | 51.33 | 51.67 |
| Fibonacci | 50.84 | 51.13 | 51.31 | 51.60 | 51.89 | 52.07 | 52.36 |
| Pivot points | S3 | S2 | S1 | PP | R1 | R2 | R3 |
|---|---|---|---|---|---|---|---|
| Standard | 45.78 | 46.96 | 48.65 | 49.83 | 52.41 | 53.20 | 54.43 |
| Camarilla | 49.54 | 49.80 | 50.06 | 50.33 | 50.59 | 50.85 | 51.12 |
| Woodie | 48.58 | 47.09 | 48.89 | 49.95 | 51.76 | 52.82 | 54.63 |
| Fibonacci | 49.16 | 49.94 | 50.41 | 51.18 | 51.96 | 52.43 | 53.20 |
| Pivot points | S3 | S2 | S1 | PP | R1 | R2 | R3 |
|---|---|---|---|---|---|---|---|
| Standard | 43.63 | 45.25 | 47.77 | 49.39 | 51.90 | 53.52 | 56.04 |
| Camarilla | 49.15 | 49.53 | 49.91 | 50.29 | 50.67 | 51.05 | 51.43 |
| Woodie | 44.09 | 45.48 | 48.22 | 49.61 | 52.36 | 53.75 | 56.49 |
| Fibonacci | 45.25 | 46.83 | 47.81 | 49.39 | 50.97 | 51.94 | 53.52 |
Numerical data
The following is the status of technical indicators and moving averages registered at the time this technical analysis was created:
| RSI (14): | 67.11 | |
| MACD (12,26,9): | 0.7800 | |
| Directional Movement: | 14.39 | |
| AROON (14): | 50.00 | |
| DEMA (21): | 51.00 | |
| Parabolic SAR (0,02-0,02-0,2): | 48.55 | |
| Elder Ray (13): | 1.25 | |
| Super Trend (3,10): | 48.74 | |
| Zig ZAG (10): | 51.56 | |
| VORTEX (21): | 1.0900 | |
| Stochastique (14,3,5): | 84.72 | |
| TEMA (21): | 51.29 | |
| Williams %R (14): | -13.06 | |
| Chande Momentum Oscillator (20): | 1.90 | |
| Repulse (5,40,3): | 0.5300 | |
| ROCnROLL: | 1 | |
| TRIX (15,9): | 0.2200 | |
| Courbe Coppock: | 4.85 |
| MA7: | 50.94 | |
| MA20: | 50.13 | |
| MA50: | 48.39 | |
| MA100: | 46.76 | |
| MAexp7: | 50.90 | |
| MAexp20: | 49.96 | |
| MAexp50: | 48.60 | |
| MAexp100: | 47.76 | |
| Price / MA7: | +0.84% | |
| Price / MA20: | +2.47% | |
| Price / MA50: | +6.16% | |
| Price / MA100: | +9.86% | |
| Price / MAexp7: | +0.94% | |
| Price / MAexp20: | +2.84% | |
| Price / MAexp50: | +5.72% | |
| Price / MAexp100: | +7.58% |
News
The last news published on BRISTOL-MYERS SQUIBB CO. at the time of the generation of this analysis was as follows:
- The University of Bristol Selects Signant Health's TrialConsent® to Assess the Impact and Value of eConsent in an Oncology Trial
- Thinking about buying stock in Bristol-Myers Squibb, Canopy Growth Corp, Intel, Target, or Tilray?
- Opdivo (nivolumab) Demonstrates Statistically Significant Overall Survival Benefit Versus Chemotherapy in Patients with Advanced Esophageal Cancer
- Bristol-Myers Squibb Announces Final Results from CheckMate -227 Part 1 Demonstrating Superior Overall Survival for Opdivo (nivolumab) Plus Low-Dose Yervoy (ipilimumab) vs. Chemotherapy in Advanced Non-Small Cell Lung Cancer
- Adjuvant Treatment with Opdivo (nivolumab) Continues to Demonstrate Extended Recurrence-Free Survival at Three Years in Resected High-Risk Melanoma Patients
About author

Online


Add a comment
Comments
0 comments on the analysis BRISTOL-MYERS SQUIBB CO. - Daily