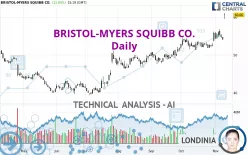
BRISTOL-MYERS SQUIBB CO. - Daily - Technical analysis published on 11/11/2024 (GMT)
- 134
- 0
Click here for a new analysis!
- Timeframe : Daily
- - Analysis generated on
- Status : INVALID

Summary of the analysis

Additional analysis
Quotes
The BRISTOL-MYERS SQUIBB CO. rating is 60.60 USD. On the day, this instrument gained +11.93% and was traded between 59.53 USD and 61.08 USD over the period. The price is currently at +1.80% from its lowest and -0.79% from its highest.The Central Gaps scanner detects a bullish gap which is a sign that buyers have taken the lead in the very short term.
Opening Gap UP
Type : Bullish
Timeframe : Openning
A study of price movements over other periods shows the following variations:
New HIGH record (1 year)
Type : Bullish
Timeframe : Weekly
New HIGH record (1st january)
Type : Bullish
Timeframe : Weekly
New HIGH record (1 month)
Type : Bullish
Timeframe : Weekly
Technical
A technical analysis in Daily of this BRISTOL-MYERS SQUIBB CO. chart shows a strongly bullish trend. The signals given by the moving averages are 92.86% bullish. This strong bullish trend is confirmed by the strong signals currently being given by short-term moving averages. The Central Indicators market scanner currently does not detect any result that concerns moving averages.
Technical indicators are slightly bullish. There is therefore considerable uncertainty about the continuation of the increase.
Caution: the Central Indicators scanner currently detects an excess:
RSI indicator is overbought : over 70
Type : Neutral
Timeframe : Daily
CCI indicator is overbought : over 100
Type : Neutral
Timeframe : Daily
Williams %R indicator is overbought : over -20
Type : Neutral
Timeframe : Daily
Pivot points : price is over resistance 3
Type : Neutral
Timeframe : Daily
Pivot points : price is over resistance 3
Type : Neutral
Timeframe : Weekly
The Central Patterns scanner, which studies chart patterns, resistances and supports, has identified this signal:
Resistance of channel is broken
Type : Bullish
Timeframe : Daily
The Central Candlesticks scanner which studies Japanese candlesticks did not detect anything.
| S3 | S2 | S1 | Price | R1 | R2 | |
|---|---|---|---|---|---|---|
| ProTrendLines | 49.89 | 52.46 | 59.63 | 60.60 | 66.94 | 75.94 |
| Change (%) | -17.67% | -13.43% | -1.60% | - | +10.46% | +25.31% |
| Change | -10.71 | -8.14 | -0.97 | - | +6.34 | +15.34 |
| Level | Intermediate | Major | Major | - | Minor | Major |
Attention could also be paid to pivot points to set price objectives:
| Pivot points | S3 | S2 | S1 | PP | R1 | R2 | R3 |
|---|---|---|---|---|---|---|---|
| Standard | 53.00 | 53.49 | 53.81 | 54.30 | 54.62 | 55.11 | 55.43 |
| Camarilla | 53.92 | 53.99 | 54.07 | 54.14 | 54.21 | 54.29 | 54.36 |
| Woodie | 52.93 | 53.45 | 53.74 | 54.26 | 54.55 | 55.07 | 55.36 |
| Fibonacci | 53.49 | 53.80 | 53.99 | 54.30 | 54.61 | 54.80 | 55.11 |
| Pivot points | S3 | S2 | S1 | PP | R1 | R2 | R3 |
|---|---|---|---|---|---|---|---|
| Standard | 50.31 | 52.14 | 53.14 | 54.97 | 55.97 | 57.80 | 58.80 |
| Camarilla | 53.36 | 53.62 | 53.88 | 54.14 | 54.40 | 54.66 | 54.92 |
| Woodie | 49.90 | 51.93 | 52.73 | 54.76 | 55.56 | 57.59 | 58.39 |
| Fibonacci | 52.14 | 53.22 | 53.89 | 54.97 | 56.05 | 56.72 | 57.80 |
| Pivot points | S3 | S2 | S1 | PP | R1 | R2 | R3 |
|---|---|---|---|---|---|---|---|
| Standard | 47.31 | 49.18 | 52.47 | 54.34 | 57.63 | 59.50 | 62.79 |
| Camarilla | 54.35 | 54.82 | 55.30 | 55.77 | 56.24 | 56.72 | 57.19 |
| Woodie | 48.03 | 49.54 | 53.19 | 54.70 | 58.35 | 59.86 | 63.51 |
| Fibonacci | 49.18 | 51.15 | 52.37 | 54.34 | 56.31 | 57.53 | 59.50 |
Numerical data
The following is the status of technical indicators and moving averages registered at the time this technical analysis was created:
| RSI (14): | 54.95 | |
| MACD (12,26,9): | 0.9500 | |
| Directional Movement: | 11.93 | |
| AROON (14): | 50.00 | |
| DEMA (21): | 54.96 | |
| Parabolic SAR (0,02-0,02-0,2): | 52.37 | |
| Elder Ray (13): | 0.21 | |
| Super Trend (3,10): | 51.84 | |
| Zig ZAG (10): | 54.14 | |
| VORTEX (21): | 1.0300 | |
| Stochastique (14,3,5): | 58.12 | |
| TEMA (21): | 54.98 | |
| Williams %R (14): | -53.31 | |
| Chande Momentum Oscillator (20): | 1.08 | |
| Repulse (5,40,3): | -2.4300 | |
| ROCnROLL: | -1 | |
| TRIX (15,9): | 0.2700 | |
| Courbe Coppock: | 11.91 |
| MA7: | 55.82 | |
| MA20: | 53.57 | |
| MA50: | 51.60 | |
| MA100: | 48.00 | |
| MAexp7: | 56.19 | |
| MAexp20: | 53.69 | |
| MAexp50: | 51.75 | |
| MAexp100: | 49.58 | |
| Price / MA7: | +8.56% | |
| Price / MA20: | +13.12% | |
| Price / MA50: | +17.44% | |
| Price / MA100: | +26.25% | |
| Price / MAexp7: | +7.85% | |
| Price / MAexp20: | +12.87% | |
| Price / MAexp50: | +17.10% | |
| Price / MAexp100: | +22.23% |
News
The latest news and videos published on BRISTOL-MYERS SQUIBB CO. at the time of the analysis were as follows:
- Bristol Myers Squibb Promotes Health Equity with 100 Percent of Marketed Products Now Supported by Access Plans
- Bristol Myers Squibb's Commitment to Environment, Social and Governance: Our Progress & Aspirational Goals
- Bristol Myers Squibb Reaches Major Milestone in Environmental Sustainability
- Bristol Myers Squibb Named to Dow Jones Sustainability Index North America
- ASPIRE: Our Commitment To Address Health Inequities in Low- and Middle-Income Countries
About author
Online


Add a comment
Comments
0 comments on the analysis BRISTOL-MYERS SQUIBB CO. - Daily